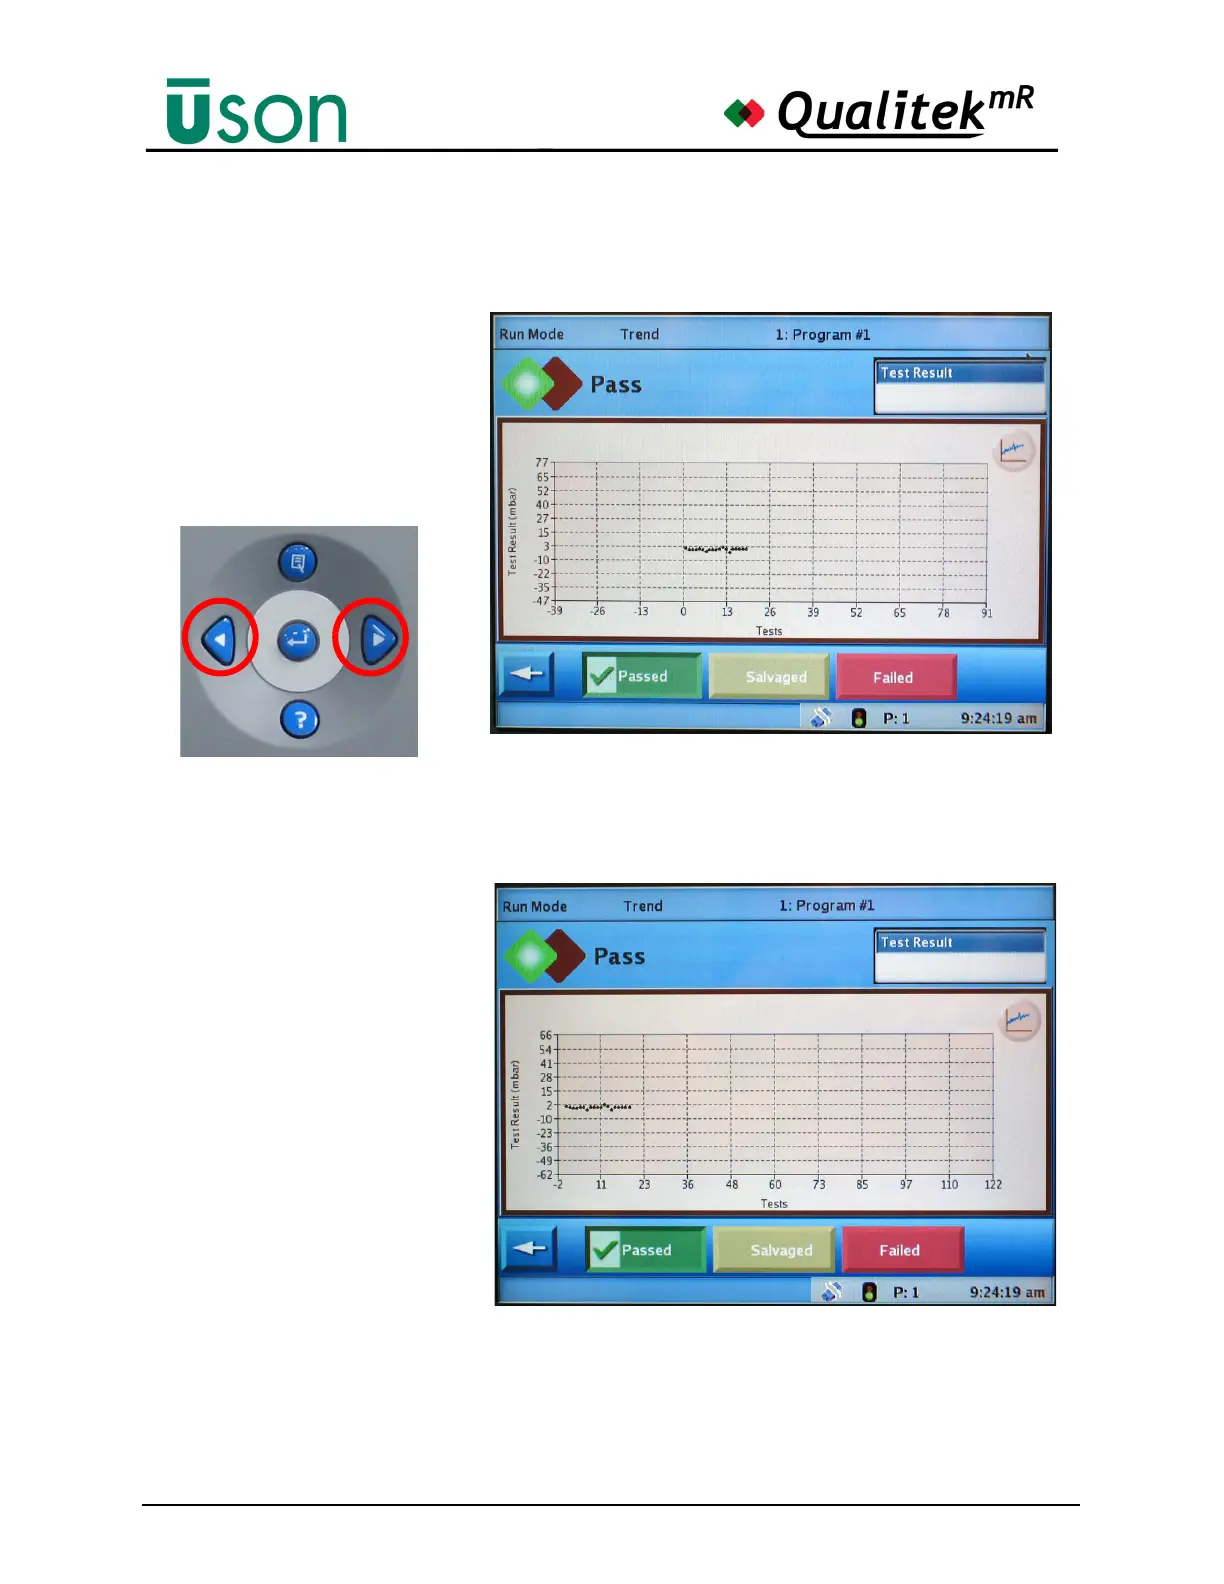
following illustration.
The Left/Right arrow keys are
used to move the x-axis to the
left or right which shifts the
plot accordingly.
The original trend plot is shown above.
The plot is now repositioned as shown after repeatedly
pressing the Right Arrow key.