Monitoring Ethernet Performance Monitoring
Port Traffic Graph
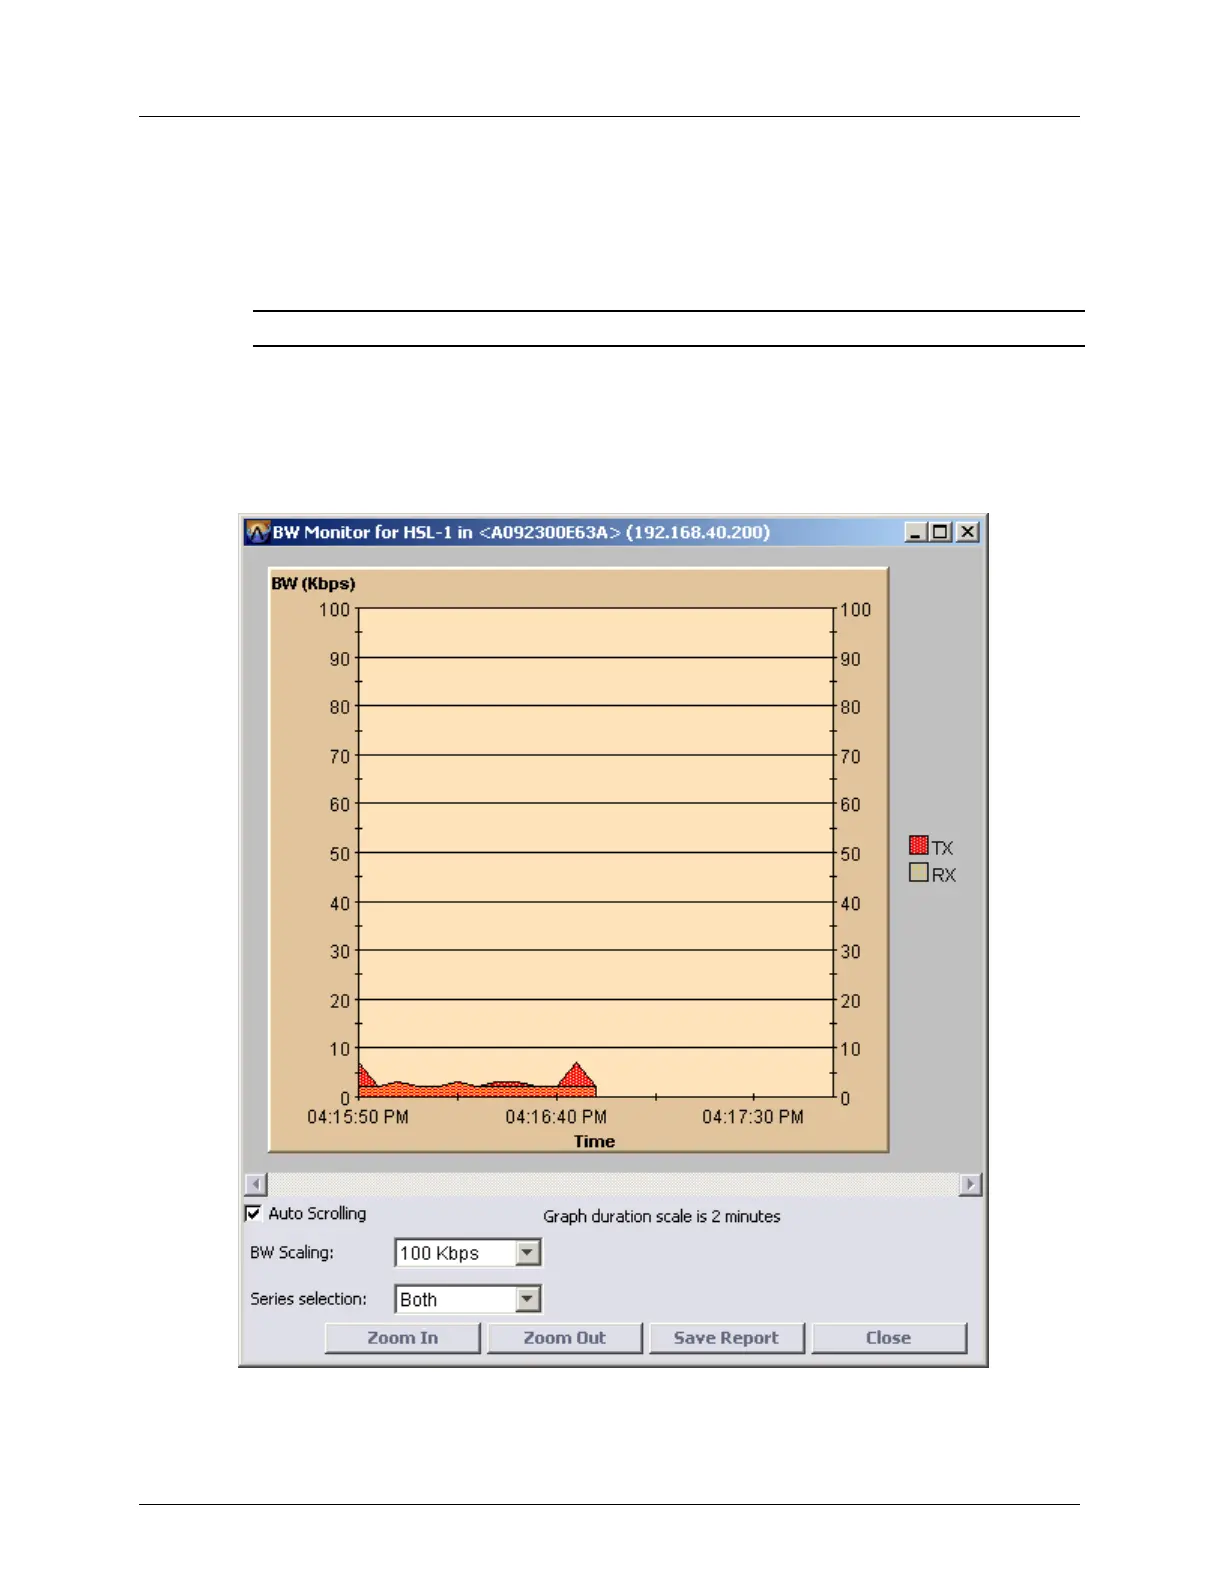
MetaASSIST View allows you to view a graphical representation of the Port traffic over
time. You can view either the Tx and Rx or both concurrently on the same graph. The graph
can also be saved to a report in .csv or .html format.
NOTE: Graphs may slow down PC operation due to lack of resources.
To display the graph
1. In the Network Element tree, open Ethernet Bridge, Port BW Monitor. The Ethernet
Port BW Monitor pane opens.
2. On the table, select a row.
3. Click View Graph. The BW Monitor for <Port> dialog appears.