Ethernet Performance Monitoring Monitoring
Table 71: Navigating the Graph
Select the item in Series Selection
Disable Auto-Scrolling (option is
enabled by default)
Clear the Auto Scrolling check box
Select the required value from the BW Scaling drop box
Display Tx data, Rx data or both
Under Series Selection choose the type of data (Tx, Rx or Both)
Use the Zoom-in and Zoom-out buttons
Click the Save Report button, and choose the requested location
and format (html or csv)
Service Bandwidth Monitoring
MetaASSIST View allows you to monitor Ethernet BW usage (average, current or max)
during on-going sessions for up to four services at a time. In addition, a graph of the transmit
and receive bandwidth can be displayed for individual services.
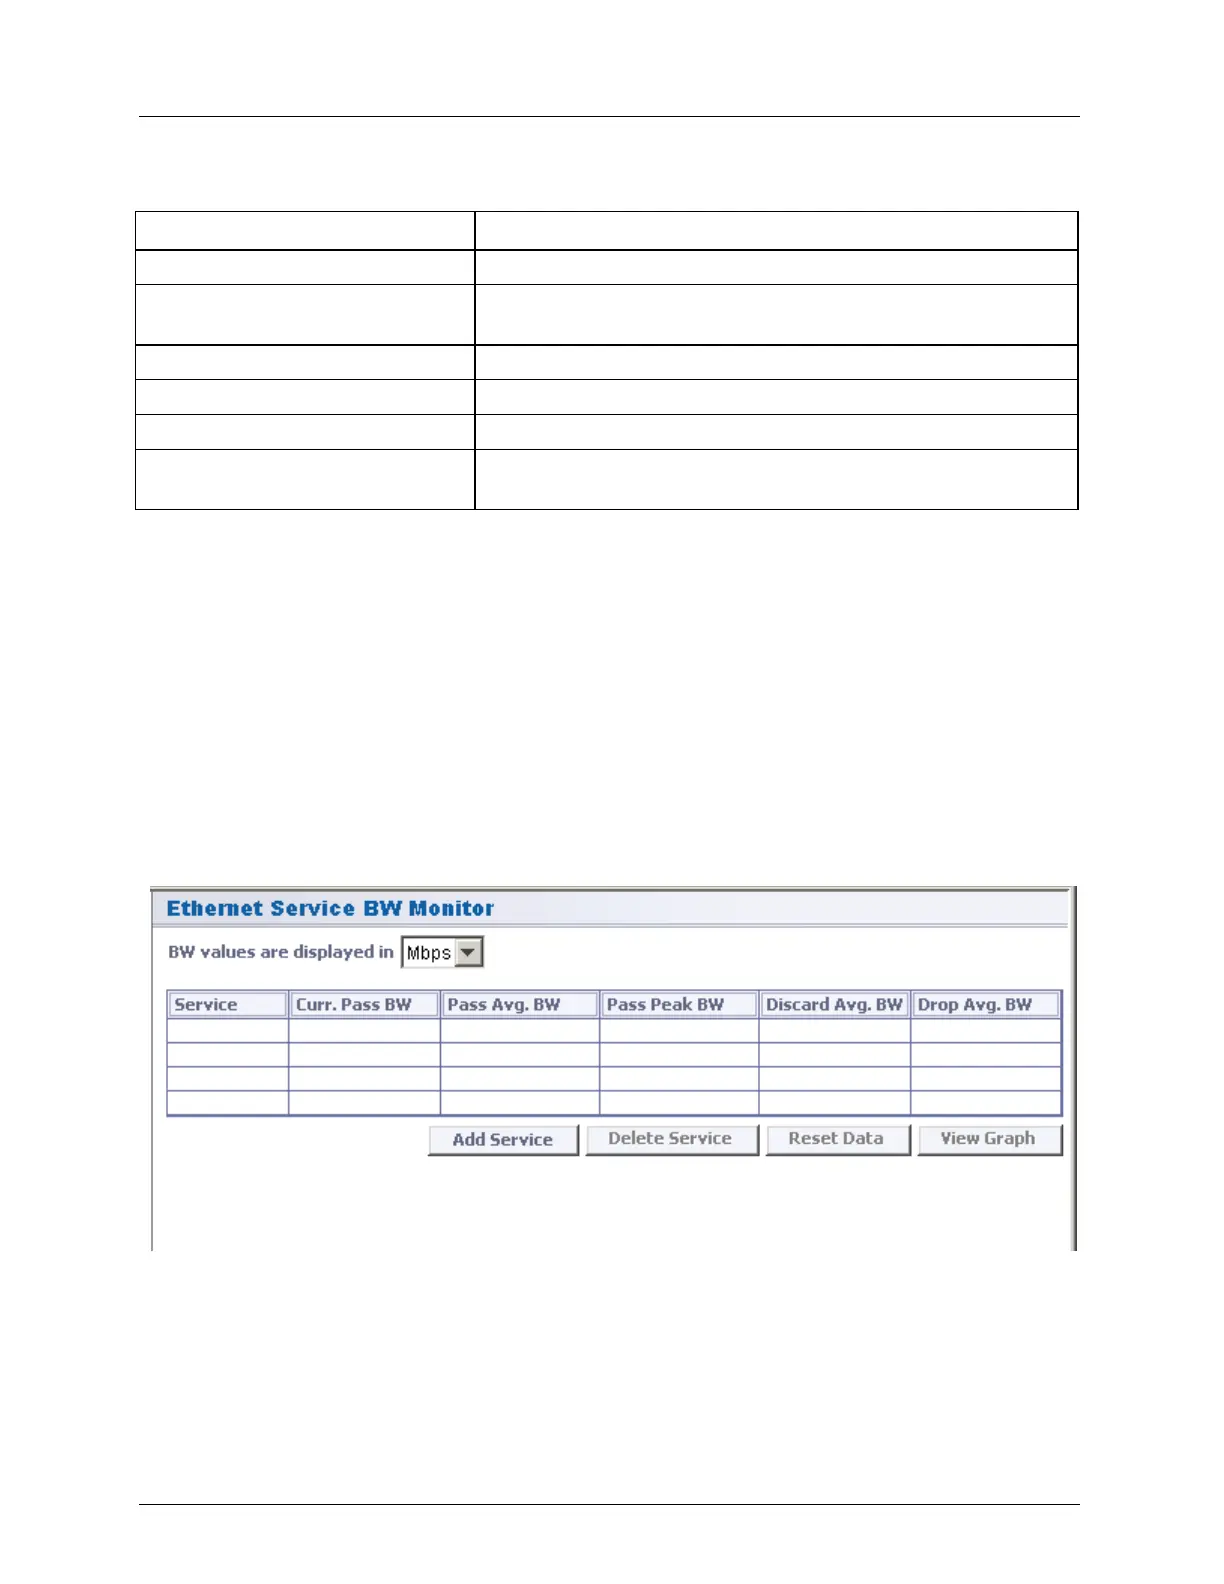
Monitoring Service Parameters
You can monitor the bandwidth parameters for up to four user defined services at a time.
To monitor the bandwidth of a service
1. In the Network Element tree, expand Ethernet Services and click Service BW
Monitoring. The Ethernet Service BW Monitor pane opens.
Each line in the pane contains a service added for monitoring and information on that
service bandwidth. Up to four services can be defined.
2. The BW Values are displayed in sets the measurement units of the display. Note that
when choosing the View Graph option, the measurement units will be as selected in the
BW Values are displayed in field.
3. To add a service to the list: