2 • DC Description
Doc. 065031-04 1/08 69
how to acquire 3D amperometry data, refer to the 3D Amperometry User’s
Manual (Document No. 065218).
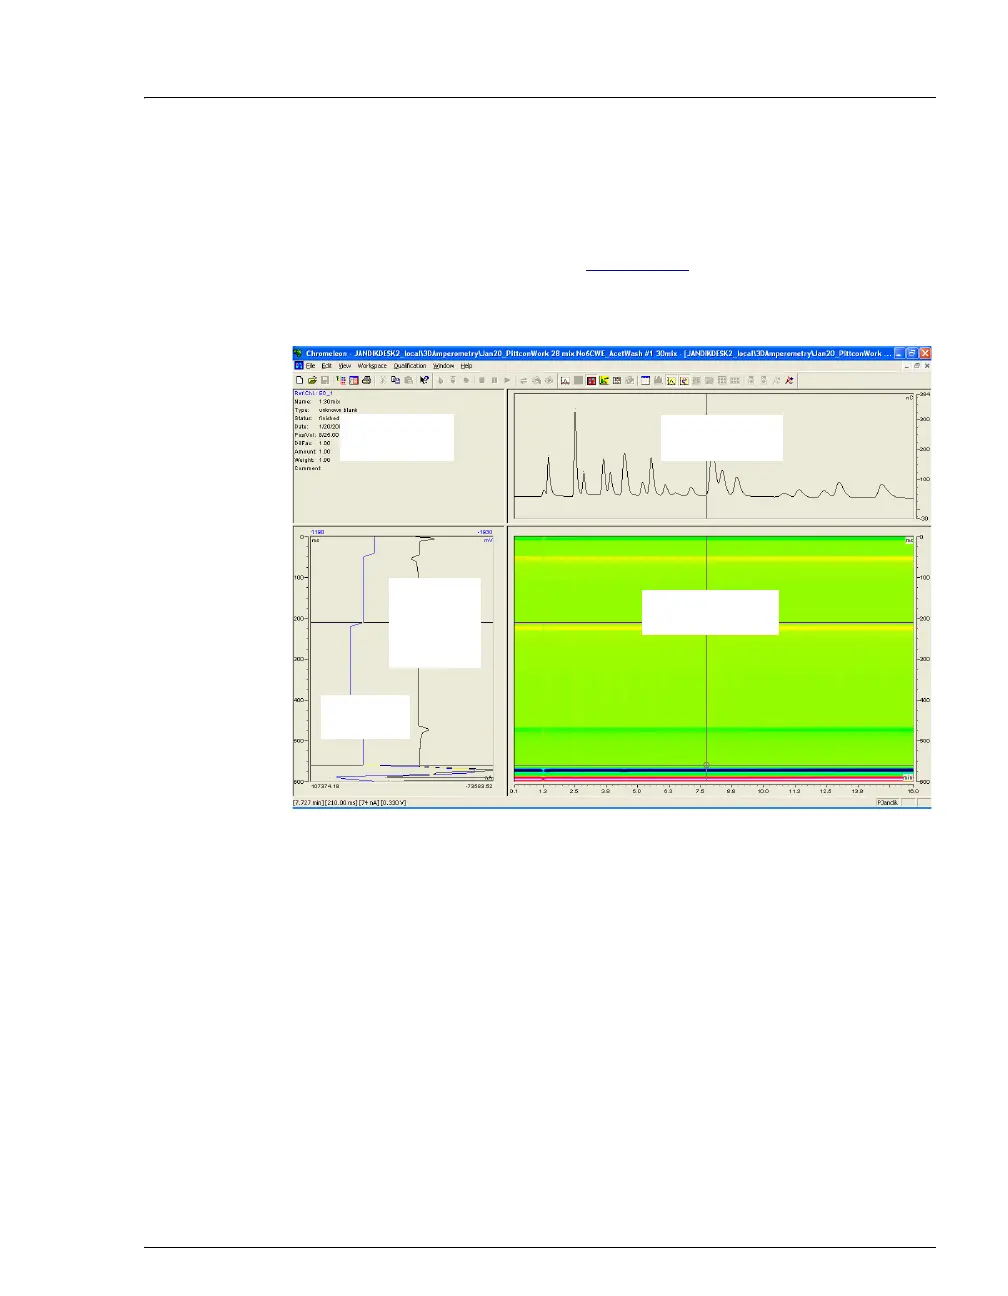
Chromeleon displays and lets you reprocess the 3D data in the 3D
Amperometry View window (see Figure 2-32
). To open the window,
double-click the sample in the Browser to open the chromatogram. On the
View menu, click 3D-Amperometry,
The window is divided into several display areas:
Figure 2-32. 3D Amperometry View Window in Chromeleon
Sample injection data Displays information about the sample.
Chromatogram plot Displays a chromatogram of data selected
in the 3D amperometry data plot.
3D amperometry data plot Displays the raw 3D amperometry data.
Waveform/I-t plot Displays an I-t plot (current vs. waveform
time) of selected data and optionally a
waveform plot.
I-t Plot
(current vs.
waveform
time)
Chromatogram
Plot
Sample
Injection Data
Waveform
Plot
3D Amperometry
Data Plot