ICS-3000 Ion Chromatography System
70 Doc. 065031-04 1/08
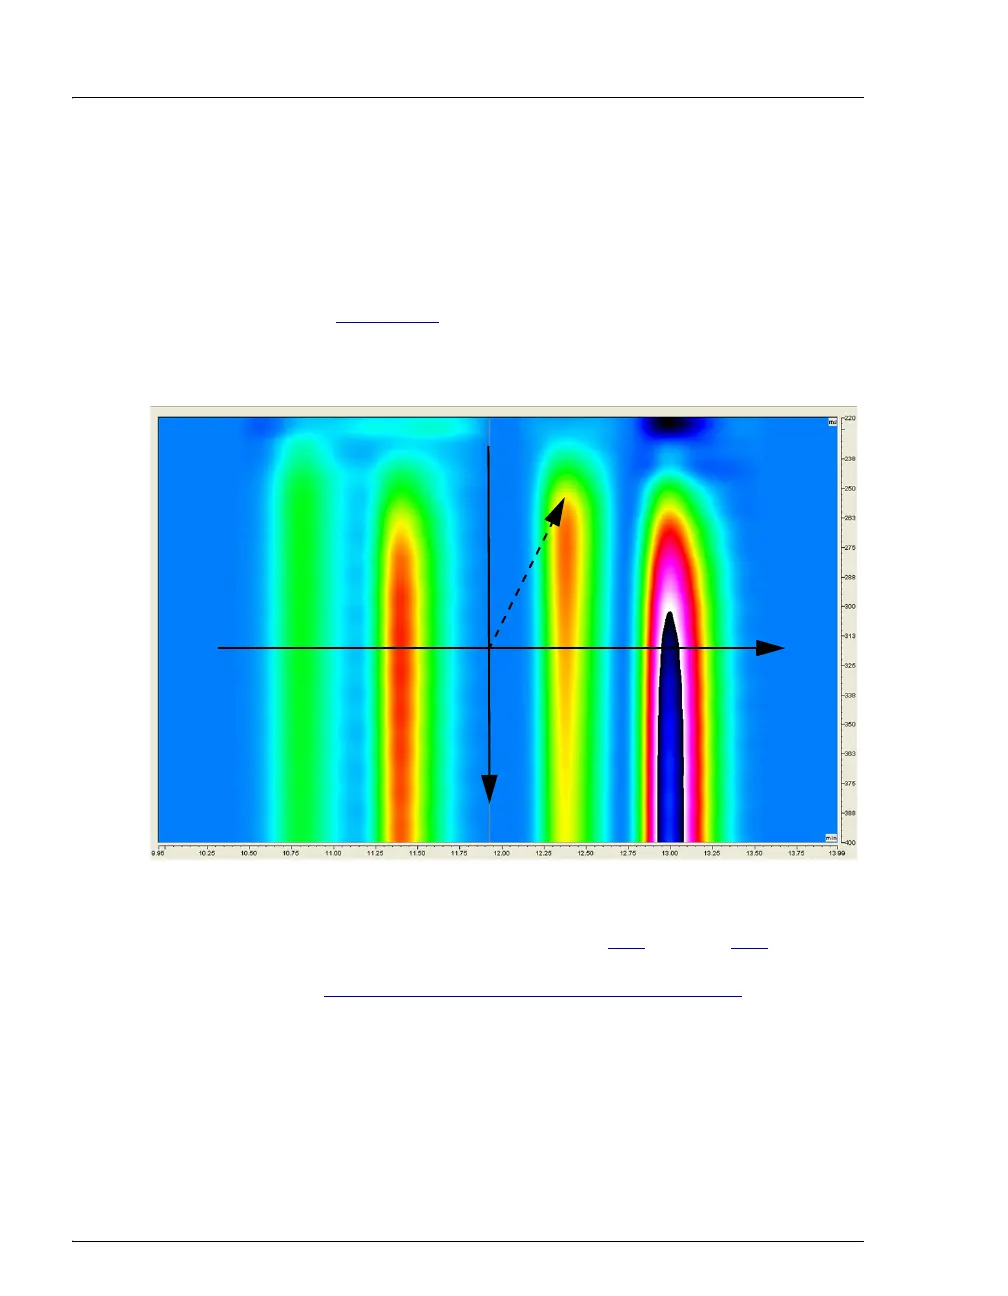
The raw 3D amperometry data plot can be viewed as either an Iso or a 3D
(wireframe) plot. For both plot types, colors are used to represent the
ranges of response values.
The Iso view is the default view for the 3D raw data. This is a top down
view of the data (imagine you are looking down on the data from above
the plot) (see Figure 2-33
). The x-axis is the retention time (min) and the
y-axis is the waveform period (ms). The z-axis, which is not visible on the
plot, is the response (nA).
NOTE The 3D data shown in Figures 2-33 through 2-36
was collected using an analytical waveform (see
“
Analytical vs. Scanning Waveforms” on page 67).
To switch to the 3D plot view, right-click on the Iso plot, select
Decoration and click the Iso/3D Plot tab. The 3D view projects the
response values in the third dimension, which allows you to see the height
Figure 2-33. 3D Amperometry Data in Chromeleon: Iso View
retention time (min)
waveform time (ms)
r
e
s
p
o
n
s
e
(
n
A
)
y
x
z