2 • DC Description
Doc. 065031-04 1/08 71
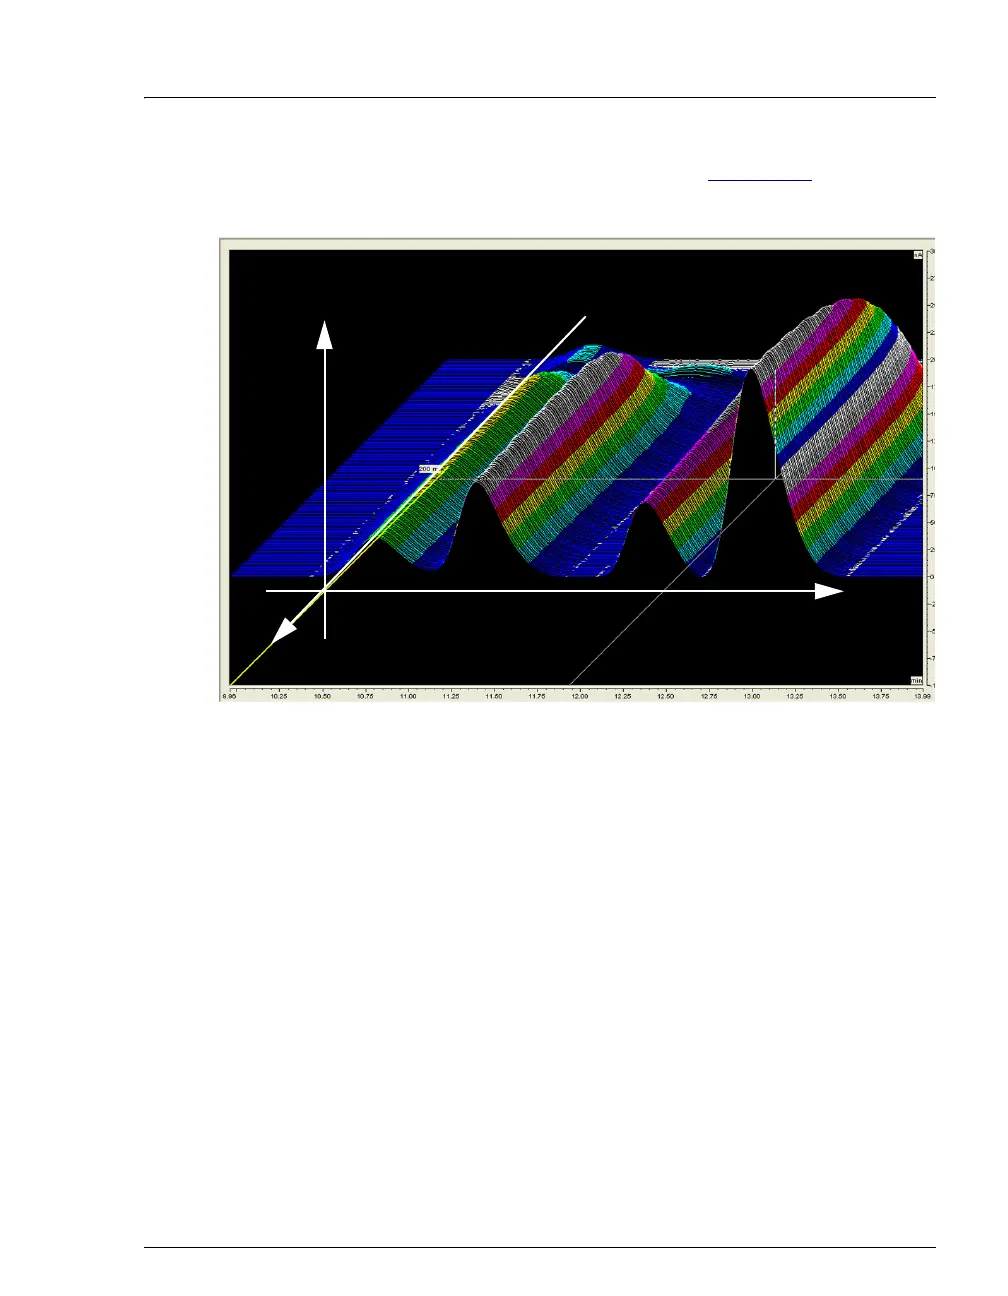
of responses as well as the color mappings (see Figure 2-34). For this
view, imagine you are standing in front and slightly to the left of the plot.
Baseline Correction
Based on the peak recognition algorithm, Chromeleon can calculate a
baseline I-t plot for each data point of a peak. Each I-t plot measured at a
given retention time can be corrected by subtracting the calculated
baseline I-t plot from the 3D amperometry data. By definition, if baseline
correction is enabled, 3D amperometry data is zero unless a peak is
present.
To enable baseline correction, select Baseline correction on the General
tab page of the 3D Amperometry Decoration dialog box.
Figure 2-34. 3D Amperometry Data in Chromeleon: 3D View
retention time (min)
w
a
v
e
f
o
r
m
t
i
m
e
(
m
s
)
response (nA)
y
z
x