4 View Types
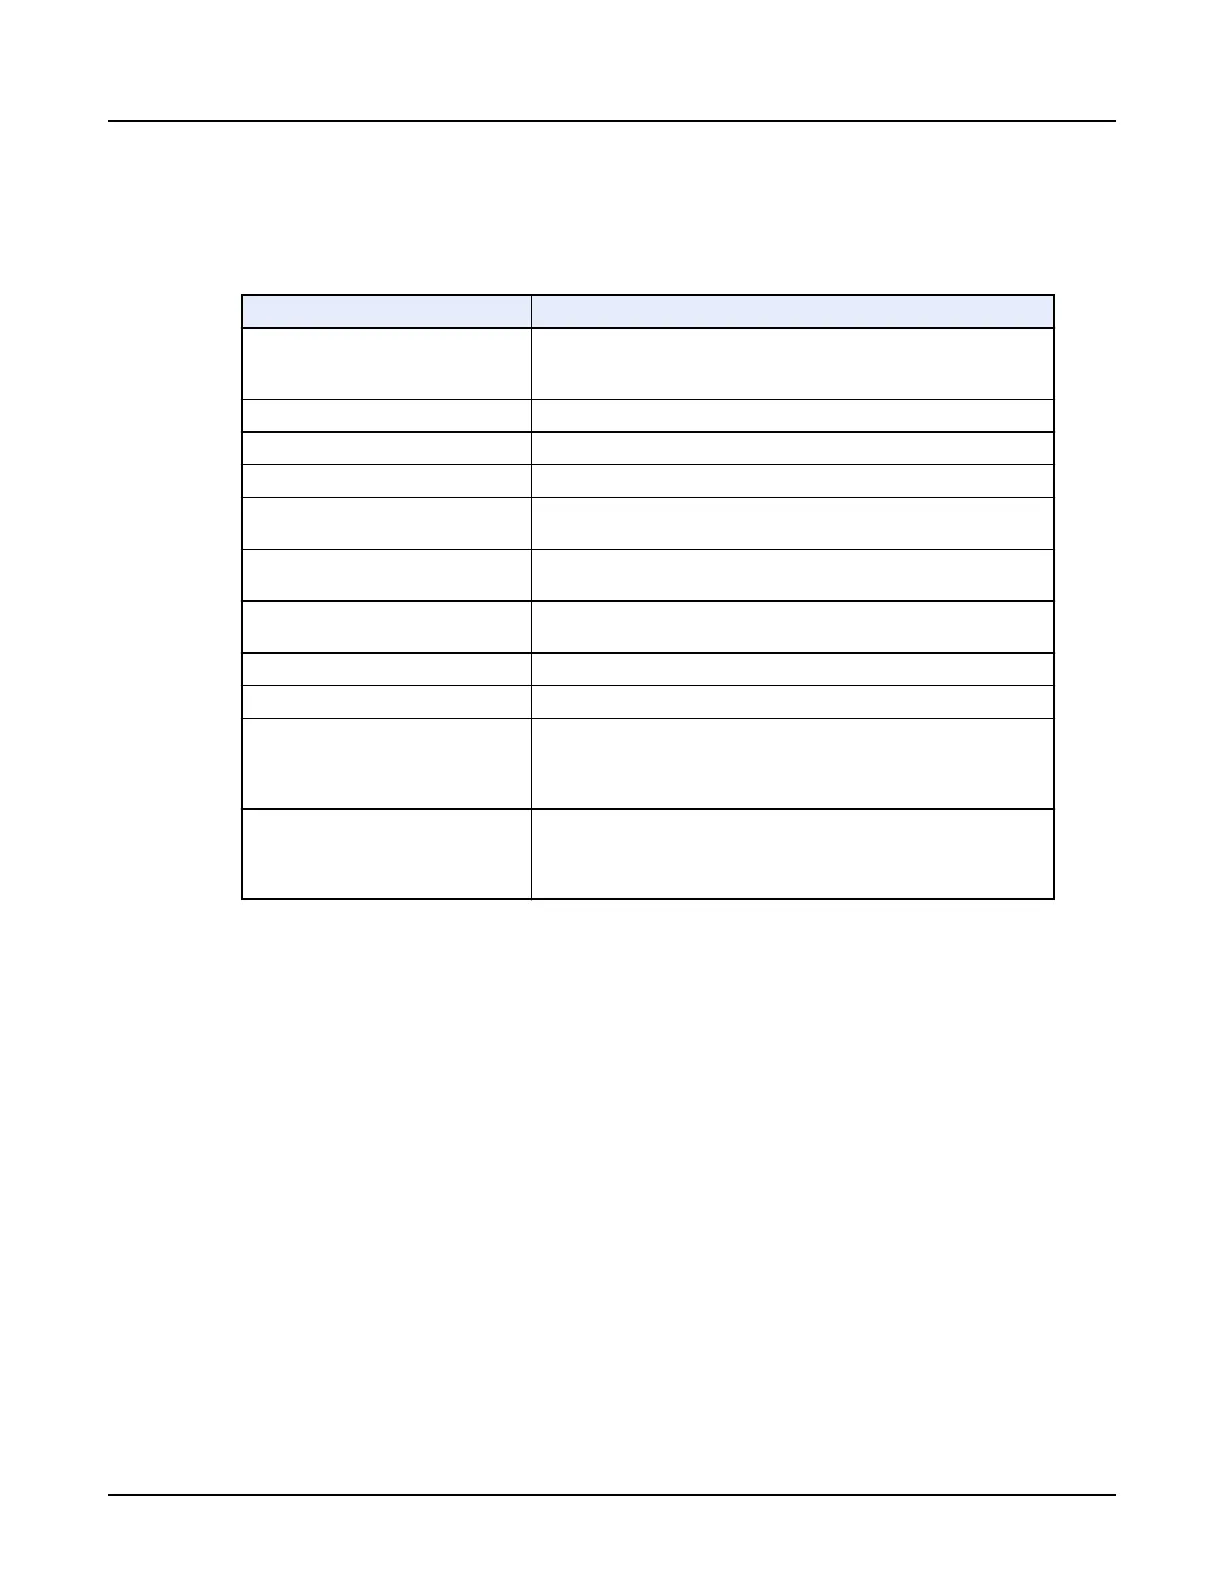
The following table contains the available view types in
Reformat
and their function.
Table 11: View Types
View Type
Function
3D
Displays the volume in 3D with different rendering. Default rendering is
high density MIP. Other modes are available from the rendering mode
red annotation.
Volume Rendered (VR)
Displays the volume in 3D color rendering.
Axial An image plane representing a cross-sectional slice of anatomy.
Sagittal An image plane dividing the body into left and right portions.
Coronal
An image plane through the body, dividing it into anterior and posterior
portions (lengthwise).
Oblique
An image plane that has been tilted through the body rather than follow‐
ing the long axis. It can look like a axial image.
Oblique 3D
A 3D image plane created by defining points along an anatomical fea‐
ture.
Curved An image plane created by defining points along an anatomical feature.
Profile A graph showing CT number intensity across a location.
Histogram (3D data)
A graph showing the percentage of occurrence and numerical statistics
of each voxel intensity value in an object and total object volume. It also
determines boundaries around a class of similar voxel intensities and
can highlight pixel values. Statistics are not valid for 2D data.
X Section
A histogram (graph) showing the percentage of occurrence and numeri‐
cal statistics, and area calculations in a user-defined surface area on a
reformatted slice. It also determines boundaries around the class of sim‐
ilar pixel intensity values in this area.
4.1 Create a Curved view
Use this procedure to display a reformat of a curved, complex view of tortuous vessels or
organs. The curved view does not need to lie along a single orthogonal or oblique plane but can
follow anatomical lines.
1.
Open
Reformat
.
2. In one of the viewports, right-click on the view type active annotation and select [Curved].
3. On an axial, sagittal, or coronal image, press and hold <Shift> as you deposit points along
the anatomy.
4. As you trace, the curved image updates automatically in the curved reformat viewport.
4.2 Create an X Section Histogram view
A histogram graph shows the percentage of occurrence of each voxel value, either in a user-
defined surface area on a reformatted slice (cross-section histogram) or in the entire 3D object
(volume histogram). It also determines boundaries around the class of similar voxel intensities.
1.
Open
Reformat
.
Revolution CT User Manual
Direction 5480385-1EN, Revision 1
464 4 View Types
 Loading...


