Stress Echo
7-24 Vivid S70 / S60 – User Manual
BC092760-1EN
01
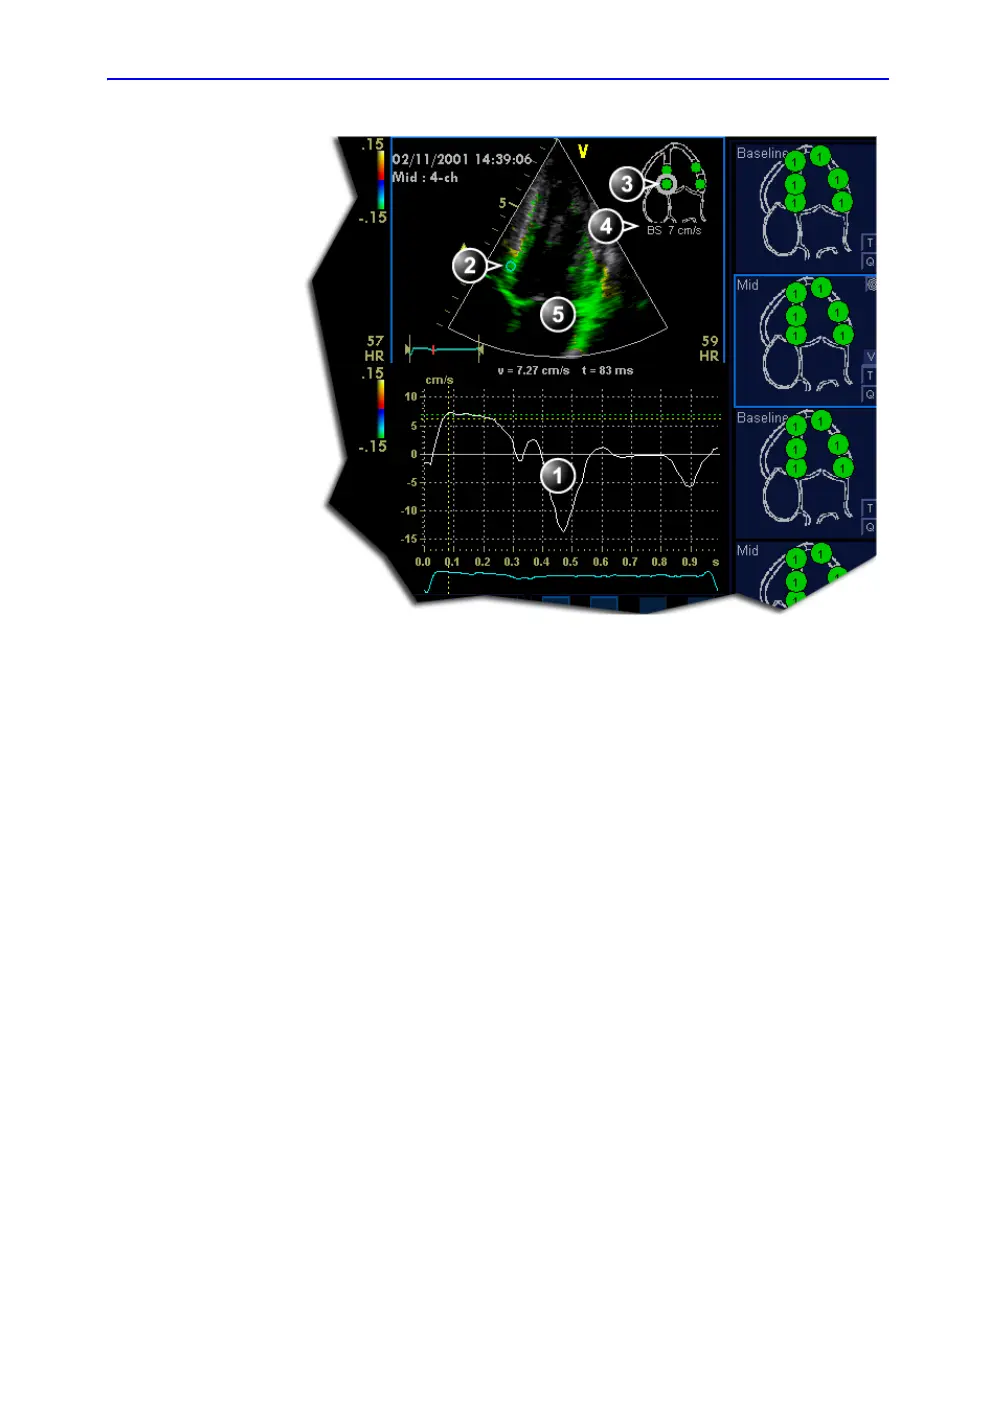
Figure 7-11. Vpeak QTVI Stress display
Turn-off the Vpeak measurement tool
1. Select the V button in the peak view scoring diagrams.
V-peak measurement interpretation
The systolic Vpeak in the tissue velocity profile is automatically
detected and highlighted by a vertical bar (Figure 7-11). The
automatically detected Vpeak should be visually verified by the
user. In addition Vpeak thresholds are displayed as color-coded
horizontal lines (Figure 7-11). These thresholds represent
statistical guideline values for peak velocity at peak stress level
(Dobutamine stress procedure) for the three apical views. Only
threshold values for basal and mid-segments for each apical
view are defined (see reference 1 on page 7-25). The result is
highlighted by a color-coding of the thresholds lines, the
1. Tissue velocity profile
2. Sampling point
3. Current segment
4. Vpeak threshold for current segment
5. Color-coded tissue velocity:
Color-coding (velocity thresholds and tissue):
• Green: velocities above threshold value
• Yellow: velocities near threshold (0 to -10% interval)
• White: velocities below threshold value - 10%

 Loading...


