Measurements and Analysis
8-16 Vivid S70 / S60 – User Manual
BC092760-1EN
01
Time to peak measurement in Q Analysis
1. From a TSI apical loop, press QAnalysis on the Touch
panel.
2. Place a sample area in a myocardial segment.
A velocity trace is displayed in the Analysis window (see
Figure 8-8).
3. Press Measure.
4. In the Measurement menu, select Generic and Time.
NOTE: If Time is not available in the Generic folder, Press Active
Mode on the Control panel.
5. In the Analysis window, measure the time from the yellow
QRS marker to the peak velocity of the velocity trace.
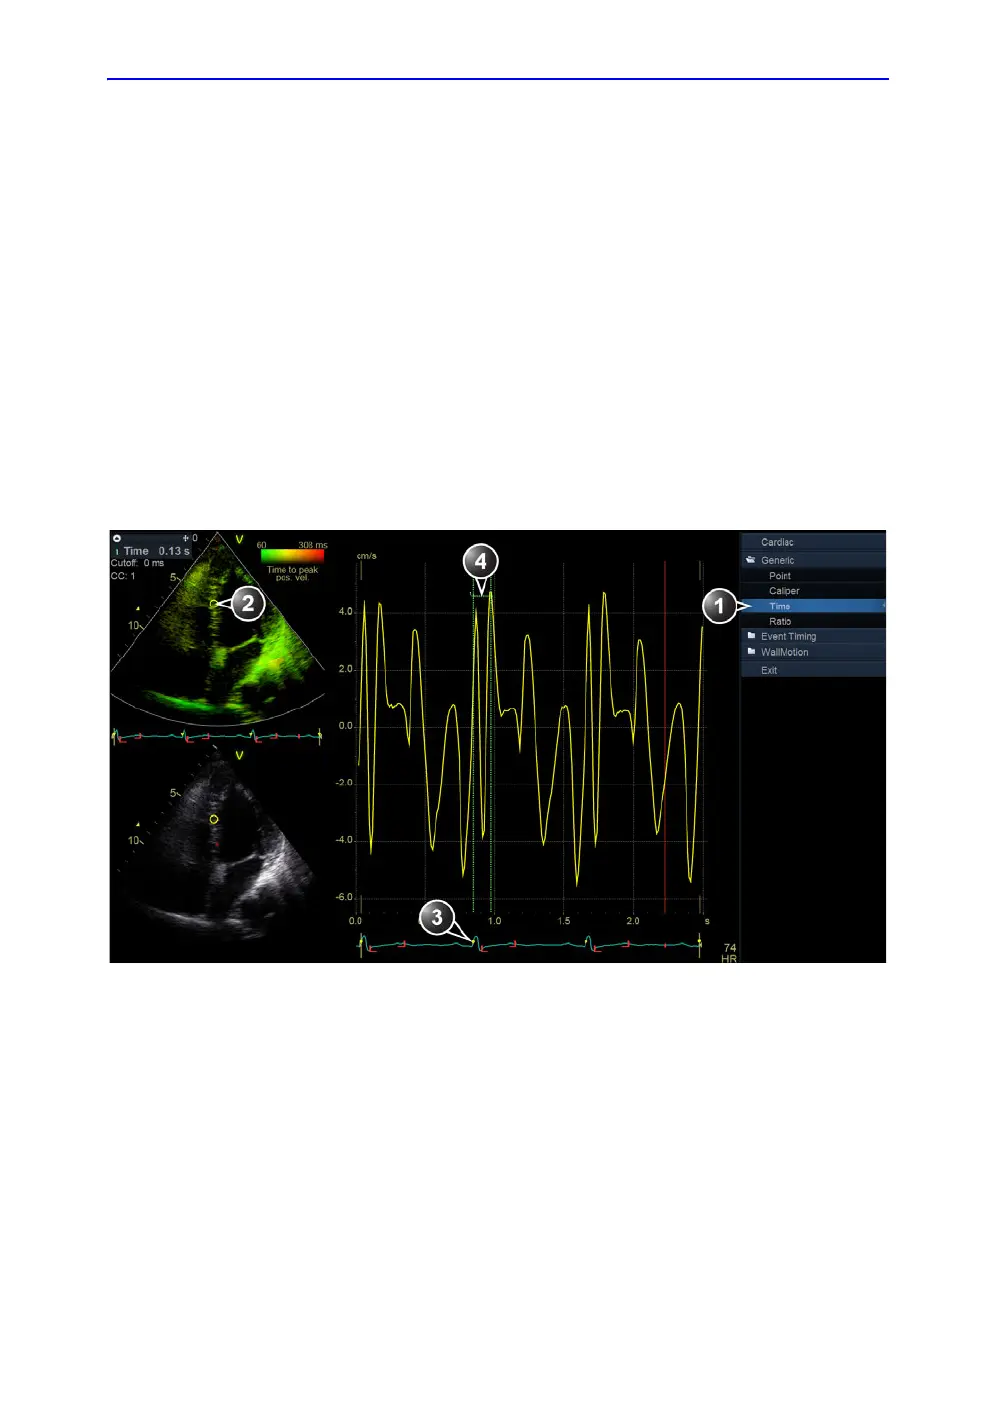
Figure 8-8. Manual TSI Time to peak measurement in Q Analysis
NOTE: It is possible to do a Generic or a Segment Time to peak
measurement from within Q Analysis and compare the result
with a manual Time to peak measurement. To access the
corresponding measurement tool in Q Analysis you may have to
press Active mode to display the relevant Measurement menu.
1. Time measurement tool
2. Sample area
3. QRS marker
4. Time to peak measurement

 Loading...


