Measurements and Analysis
8-92 Vivid S70 / S60 – User Manual
BC092760-1EN
01
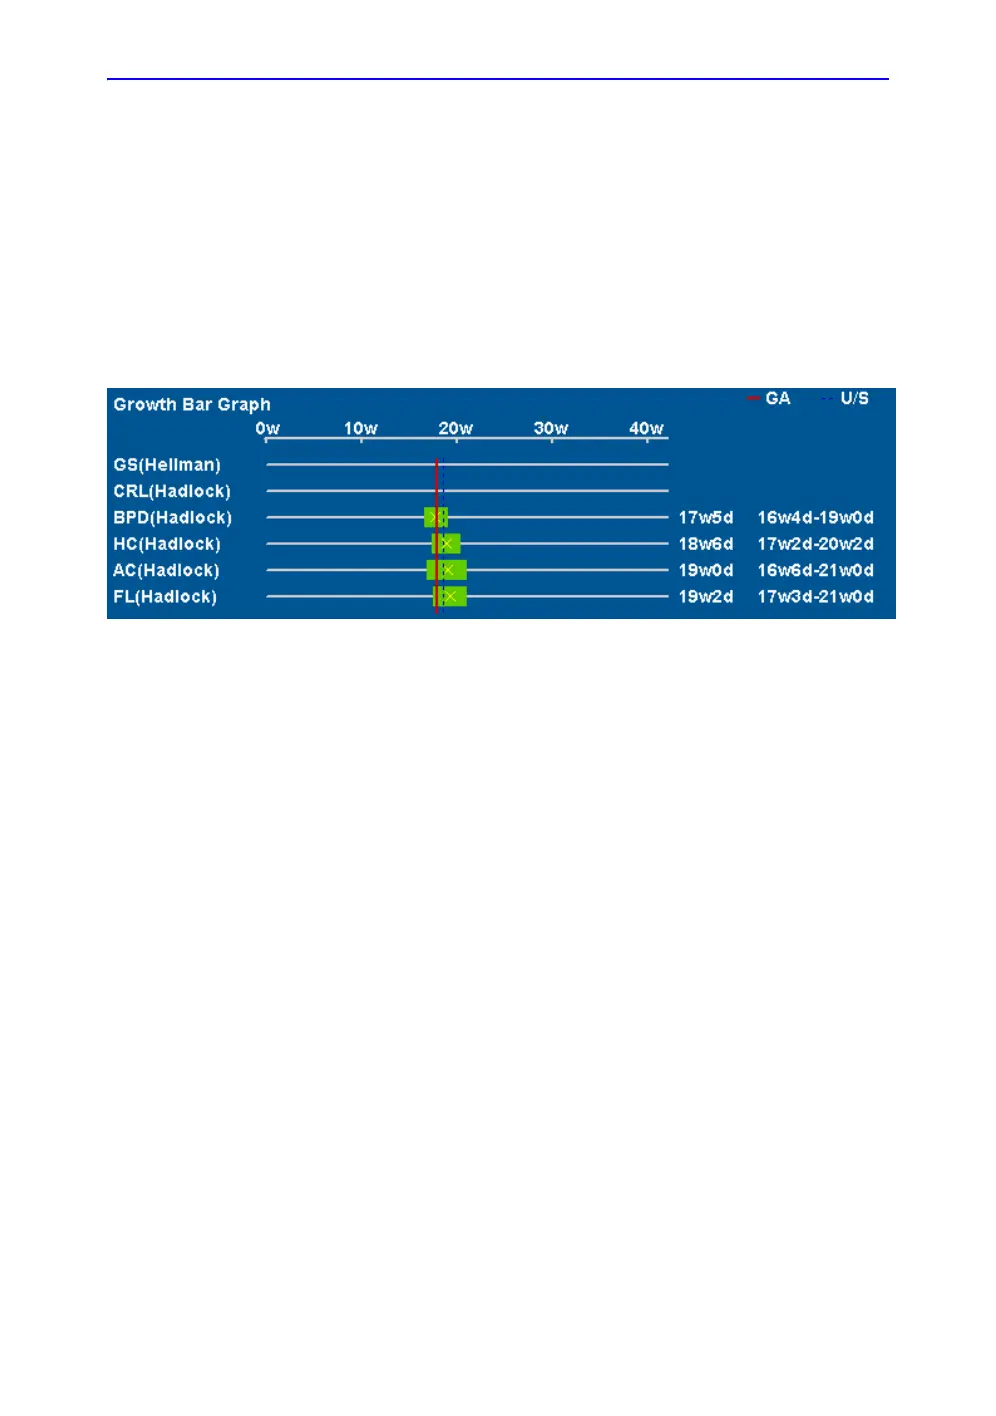
Fetal growth bar graph
The fetal growth bar graph shows current exam measurements
and the normal growth range based on the gestational age. It
shows all measurements on one graph.
1. Press Worksheet.
2. Press Graph.
3. Press Bar.
The fetal growth bar graph is displayed.
Figure 8-53. Fetal growth bar graph
• The horizontal axis shows the gestational weeks.
• The red vertical line shows the gestational age using the
patient data.
• The blue dotted vertical line shows the ultrasound age
using the current measurements.
• The yellow x shows the ultrasound age for each
measurement.
• The green rectangle shows the normal age range for the
measurement.

 Loading...


