Q Analysis overview
Vivid S70 / S60 – User Manual 9-7
BC092760-1EN 01
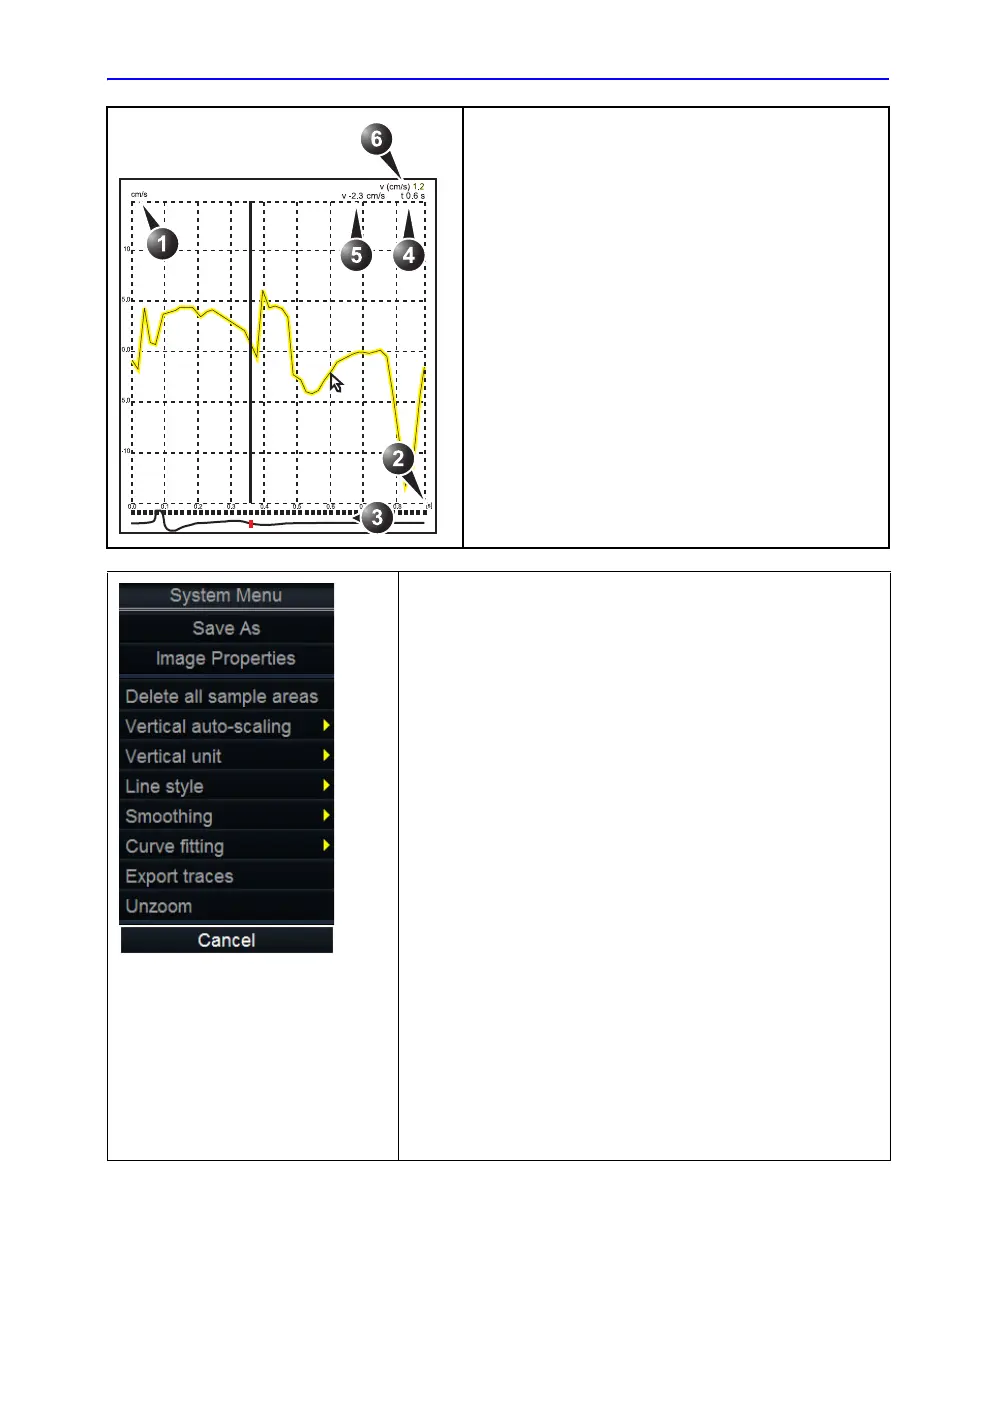
Strain:
Displays Strain trace (extent of tissue deformation (%))
1. Y axis: percent displacement
2. X axis: time (s)
3. ECG with Strain start and Strain end markers
4. Time at cursor position
5. % deformation at cursor position
6. % deformation at frame marker position (color
coded)
Contrast:
Displays time-intensity curve
1. Y axis: Intensity scale (logarithmic) (dB) or linear
acoustic units (AU).
2. X axis: Time (s) or dT (s), elapsed time from previous
frame.
3. ECG: displays ECG trace, the current frame marker
and the start and stop markers for the cineloop.
4. Time at cursor position
5. Intensity (dB or AU) at cursor position
6. Intensity (dB or AU) at frame marker position (color
coded)
a)
With contrast data only.
b)
Shown only in zoom mode.
The analysis window System menu:
This menu is displayed by pressing Update menu when the cursor
is in the Analysis window.
• Delete all Sample areas: removes all traces at once.
• Analysis signal: toggles trace display between velocity,
displacement, strain rate, stain or greyscale intensity curves.
• Drift compensation: compensates drifting of strain or Tissue
Tracking curves by either resetting the curve to zero at the
tracking start point (cycle resetting) or by linear compensation
throughout the cycle (linear compensation)
• Vertical auto-scaling: selects between full unit range or a range
according to the maximum and minimum values of the displayed
trace(s).
• Vertical unit
a
: toggles between logarithmic (dB) and linear
acoustical units (AU).
• Line style: selects between solid line only or solid line with
square markers at each data point.
• Smoothing: smooths the trace displayed by applying a filter over
a defined time window. Both the filter type and time window are
user-selectable. The type of filter available is depending on the
analysis signal displayed.
• Export traces: saves trace data in ASCII format, readable in
spreadsheet programs. If present, trace data for physiological
traces are also exported.
• Curve fitting
a
: toggles between Wash-in, Wash-out and off.
• Unzoom
b
: restores full analysis window display when in zoom
mode.
• Cancel: exits the System menu.

 Loading...


