Quantitative Analysis
9-6 Vivid S70 / S60 – User Manual
BC092760-1EN
01
The Tissue cineloop window
The analysis window
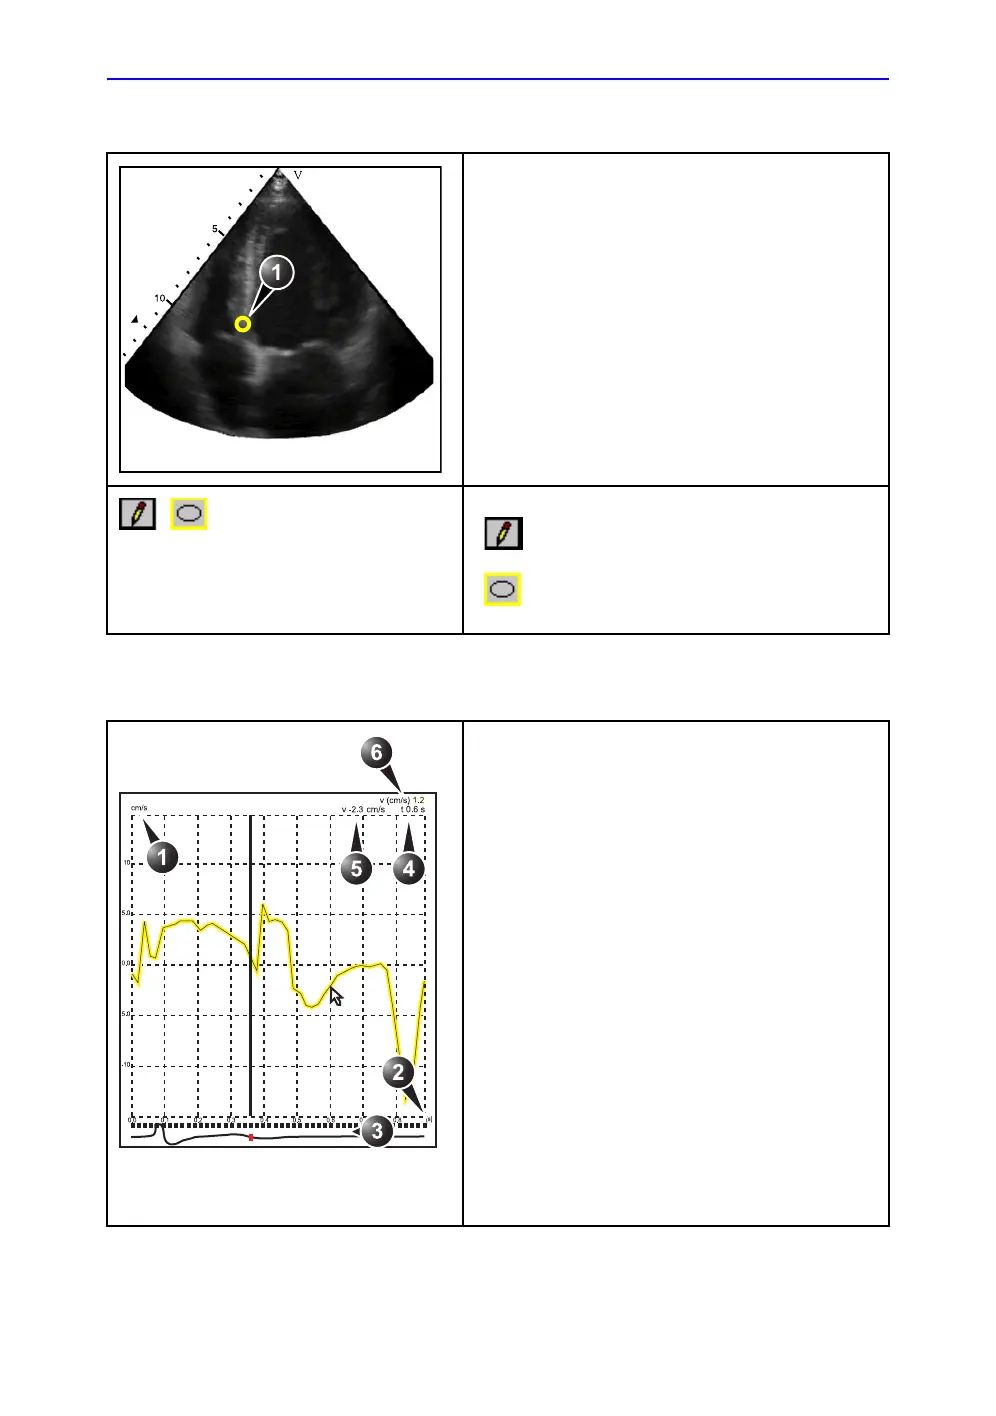
Displays 2D data
Sample area (1):
Indicates sampling position of the velocity (TVI),
displacement (Tissue Tracking), percent deformation
(Strain), deformation rate (Strain rate) or intensity
(Contrast) trace. The sample area is color-coded: the first
sample area is yellow, the second blue...etc.
Sample area tools:
• : creates a sample area based on freehand
drawing.
• : creates a sample area with a pre-defined circular/
elliptic shape (configurable, see page 9-15)
TVI:
Displays velocity trace
1. Y axis: velocity scale (cm/s)
2. X axis: Time (s)
3. ECG
4. Time at cursor position
5. Velocity at cursor position
6. Velocity at frame marker position (color coded)
Tissue Tracking:
Displays tissue displacement trace
1. Y axis: displacement scale (mm)
2. X axis: time (s)
3. ECG with Tracking start and Tracking end markers
4. Time at cursor position
5. Displacement at cursor position
6. Displacement at frame marker position (color coded)
Strain rate:
Displays Strain rate trace (rate of deformation (s
-1
))
1. Y axis: s
-1
2. X axis: time (s)
3. ECG
4. Time at cursor position
5. Strain rate at cursor position
6. Strain rate at frame marker position

 Loading...


