Operation – Monitoring and Diagnosis
User Manual corpuls
3
100 ENG - Version 2.1 – P/N 04130.2
Fig. 6-4 Real-time printout, section
The millivolt mark (in form of a rectangular impulse) is located at the left margin
of the curve field (mV-mark). Its height depends on the set amplification of the
ECG curve. The mV mark shows an amplitude height of 0.5 or 1 mV for
comparison, so that the amplitude of the ECG curve displayed can be
determined.
The real-time printout has vertical markings on the upper and lower edges that
help to fold the printout quickly. The folded printout fits the width of a standard
sheet of paper (DIN A4) and can be attached there for documentation.
Caution
At temperatures below zero °C the alarm "ECG electr. (x) loose " can be
impaired.
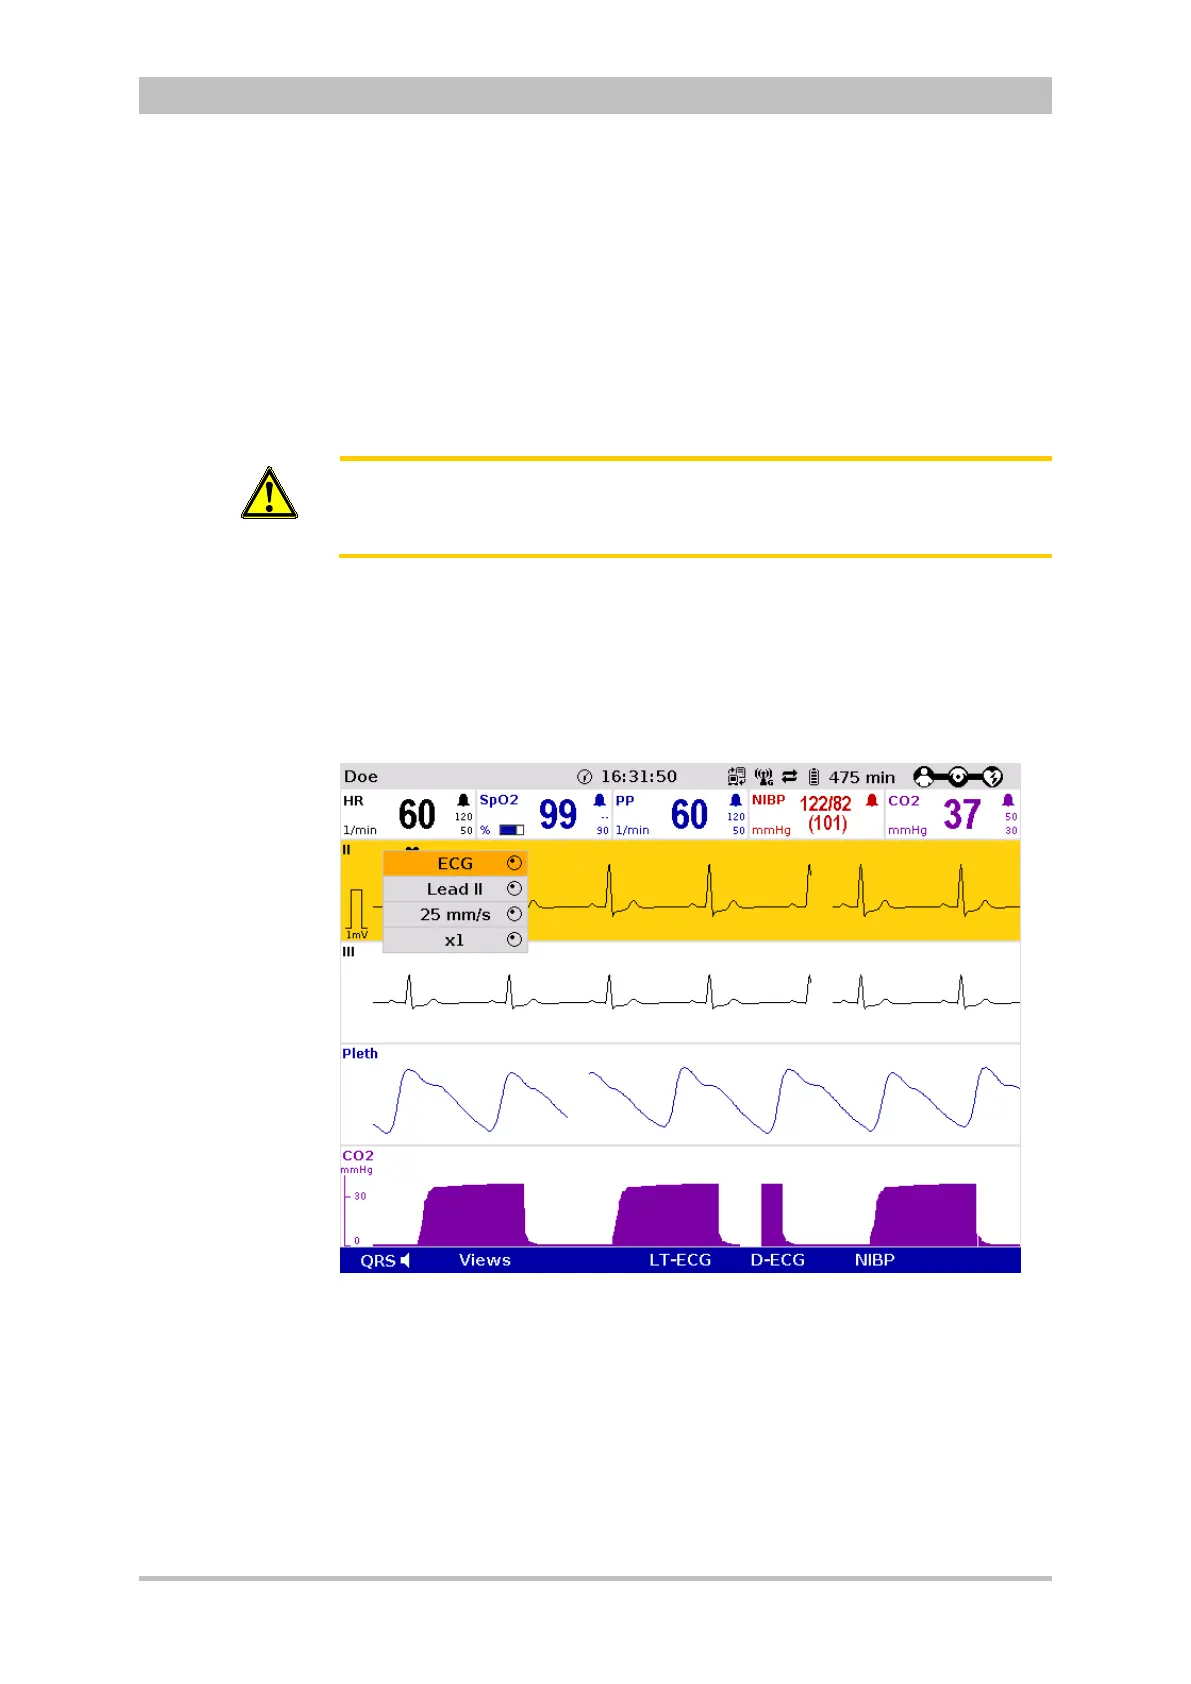
6.2.5 Adapting the Representation of the ECG Curve
Up to six leads can be displayed simultaneously. The number of the curves
displayed can be configured (see chapter 7.1.2 Display Configuration, p. 140).
1. Select the curve to be adapted and open the curve context menu (see
chapter 4.3.2 Softkey Context Menu, p. 47).
Fig. 6-5 ECG monitoring, adapting the curves
2. Select the required lead in the curve context menu and confirm. The
required lead is displayed.
3. Repeat steps 1 and 2 for further curves if necessary.
The amplitude of the displayed ECG curves can either be adjusted
automatically by the device or adjusted manually (see chapter 7.2.1 ECG
Monitoring, p. 148).