Operation – Monitoring and Diagnosis
User Manual corpuls
3
124 ENG - Version 2.1 – P/N 04130.2
6.6.3 Performing CO
2
Measurement
Measurement begins automatically after the sensor has been attached.
1. Select the curve field for display of CO
2
trend and open the curve context
menu
2. Assign CO
2
monitoring to the selected curve field (capnogram).
3. Select the parameter field for display of the end-expiratory CO
2
concentration and open the parameter context menu.
4. Assign CO
2
monitoring to the selected parameter field.
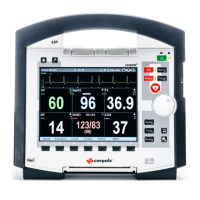
Fig. 6-25 CO
2
monitoring, configured screen
1 Current end-expiratory CO
2
concentration in mmHG
2 Symbol for switched-on alarms
3 Upper alarm limit
4 Lower alarm limit
5 CO
2
curve (capnogram)
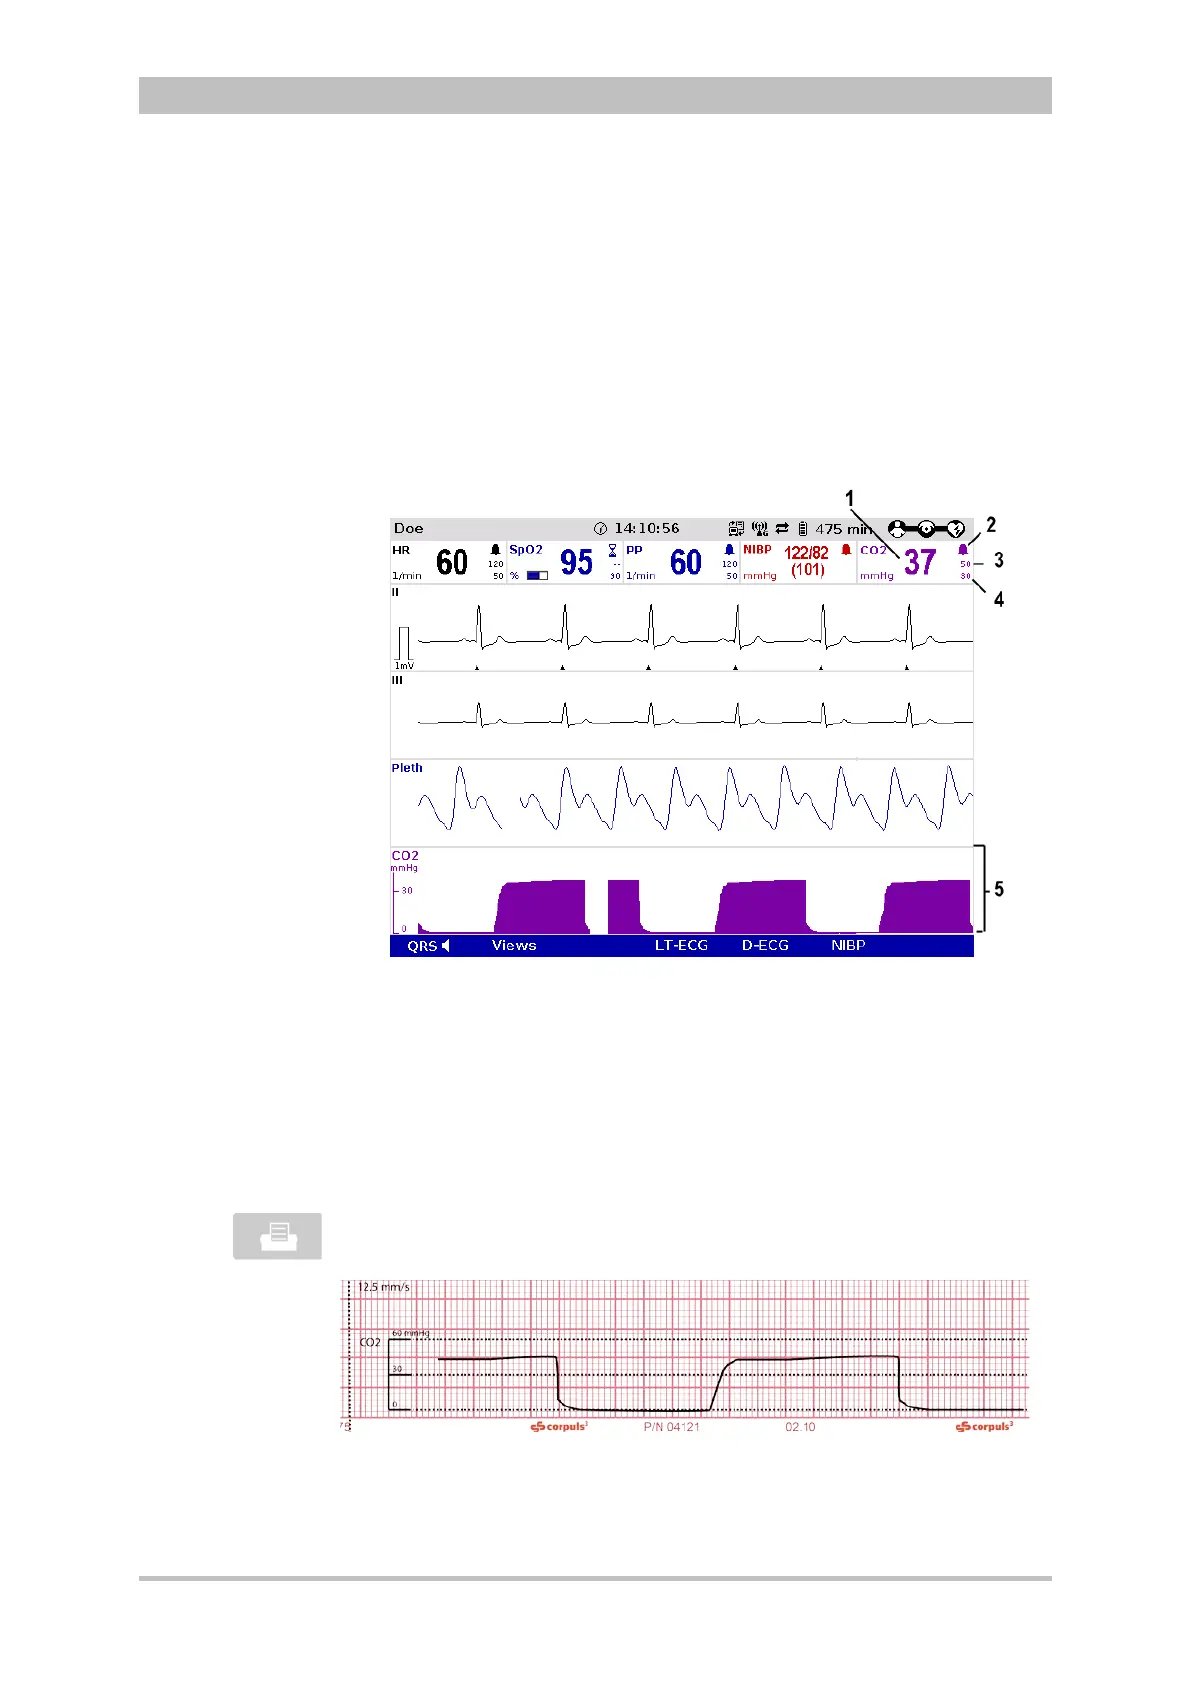
The CO
2
curve can be printed out with the integrated printer. See chapter 7.1.3,
p. 143 for further information on configuring the printout.
To start or stop real-time printing press the Print key.
Fig. 6-26 CO
2
monitoring, section of a printout
The CO
2
nasal(/oral) disposable adapter may be used no longer than 24 hours.