7: Networking
EMG™ Edge Management Gateway User Guide 145
To view results for a Performance Monitoring probe:
1. Click the Network tab and select the Perf Monitoring option. The Network > Perf Monitoring
page displays.
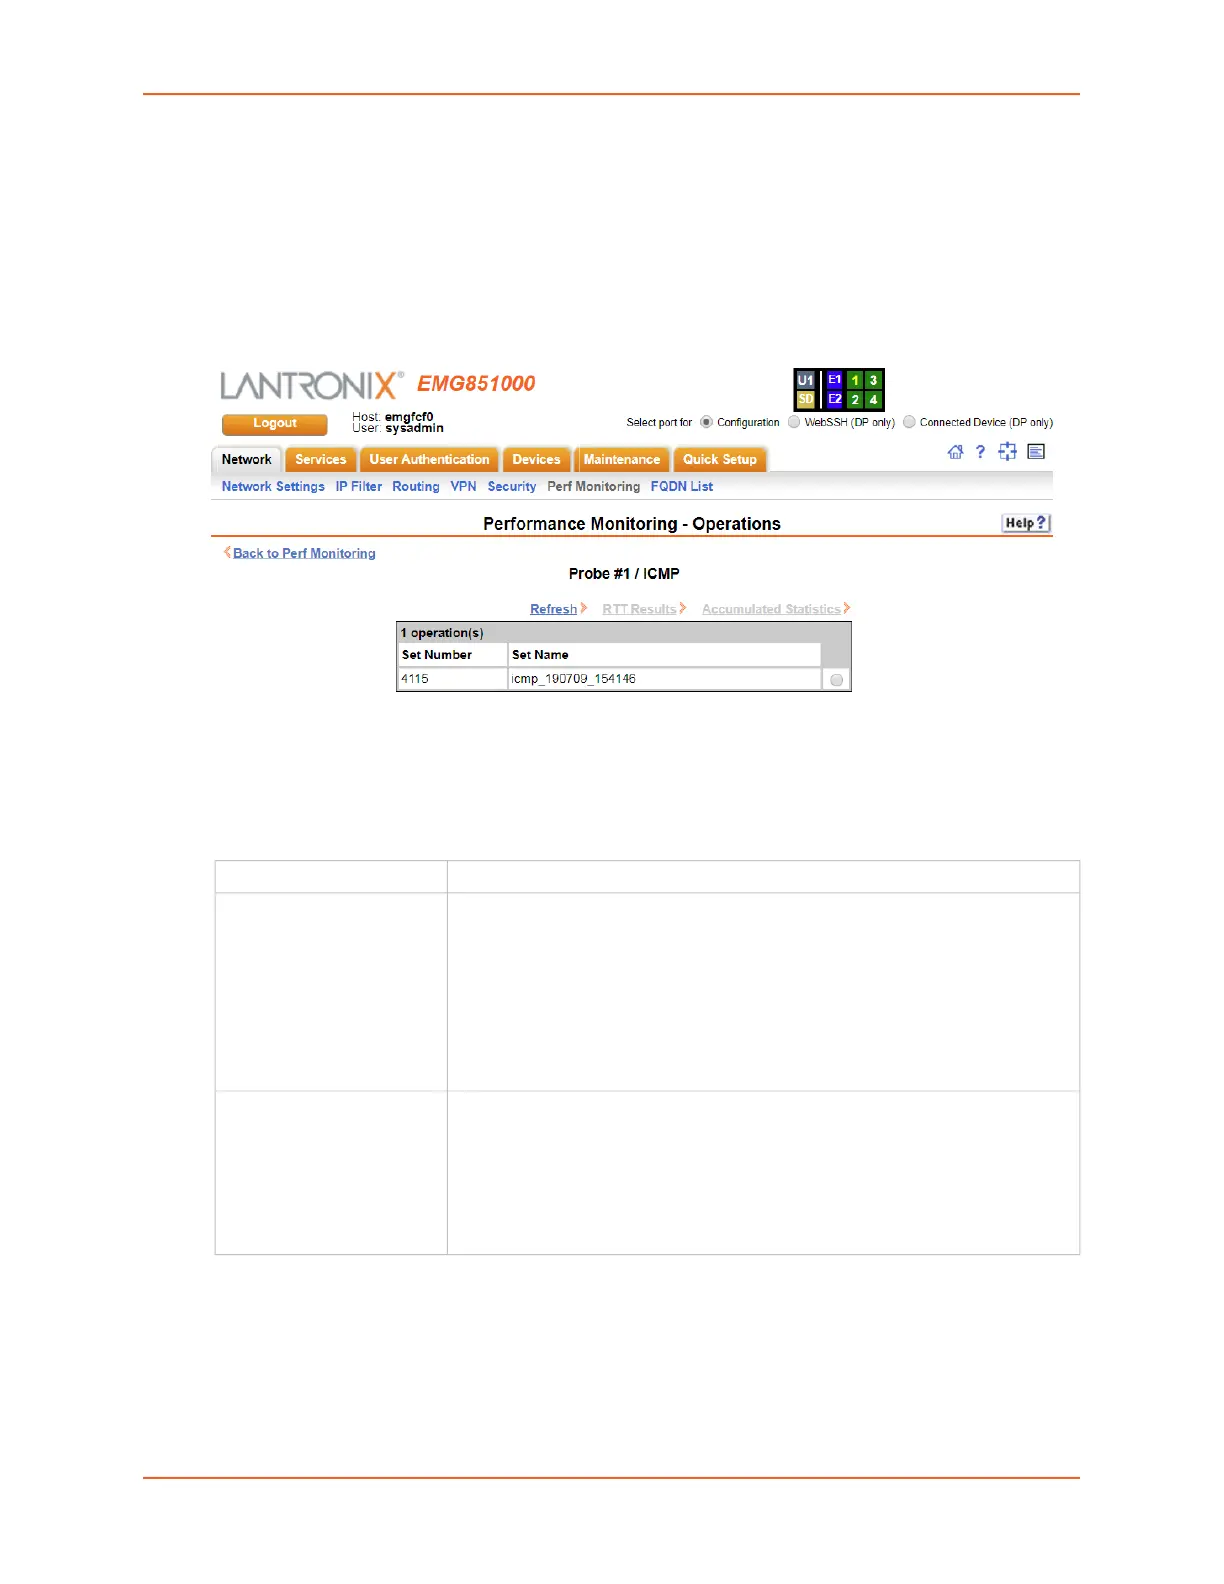
2. Select a probe from the table in the lower part of the page and select the Operations link. The
Performance Monitoring - Operations page displays.
Figure 7-17 Performance Monitoring - Operations
3. A table will list all available operations for the selected probe, with the most recent operation
listed first. The table may be empty if no operations have been run for the probe or the
operations for the probe have been deleted. Select an operation by clicking the radio button to
the far right in the operation's row. The options that are available for that operation will be
ungreyed. Select one of the following options:
Performance Monitoring Commands
Go to Performance Monitoring Commands to view CLI commands which correspond to the web
page entries described above.
Refresh Refreshes the information on the Performance Monitoring - Operations page.
RTT Results Displays the round trip time (RTT) results for the selected operation in a
separate window. The results show:
the time that the packet was sent,
the total round trip time for non-jitter probes or the source to destination time
and destination to source time for jitter probes, and
the status for the packet - OK/successful or an error condition.
For more information, see Round Trip Times or Error Conditions Detected by
Probes).
Accumulated Results Displays the accumulated statistics for the selected operation in a separate
window. The results show parameters used for the selected operation, and the
minimum, average and maximum round trip times for all probes. For jitter
probes, the results show minimum, average and maximum one way latency
times, as well as jitter results for source to destination and destination to
source. For a probes, a summary of lost packets and error conditions is
displayed.
 Loading...