15 - 14
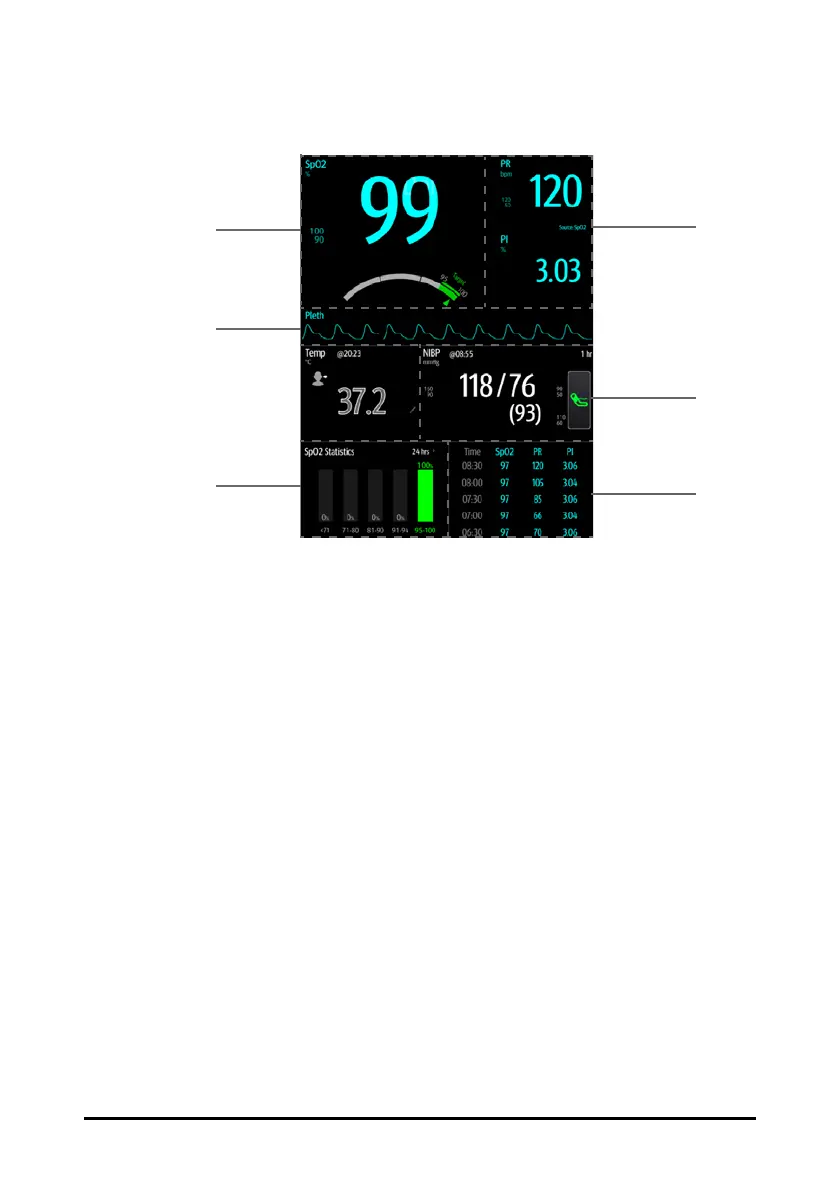
15.4.2 The Display of the Targeted Goal Screen
1. Target parameter area: displays the SpO
2
measurement in big numerics, as well as
its target range, and alarm limits.
◆ The dashboard shows the target range in green.
◆ The △ pointer below the dashboard indicates the current measurement
value.
2. Target parameter waveform area: displays the SpO
2
waveform.
3. Target parameter statistics area: displays the SpO
2
statistics by sections.
4. Parameter trends area: displays trends of the target parameter and secondary
parameters.
5. Other parameter area: displays parameter measurements and alarm limits of
parameters other than the target parameter and secondary parameters.
6. Secondary parameters area: displays parameter measurement of PR and PI in big
numerics, as well as parameter sources and alarm limits.
15.4.3 Operating the Targeted Goal Screen
You can access parameter setup and trends review from the Targeted Goal screen.
■ Select the parameter trends area to enter the Tabular Trends review page.
■ Select the target parameter statistics area to enter the parameter statistics setup
menu. Set the range of each section and the target section.