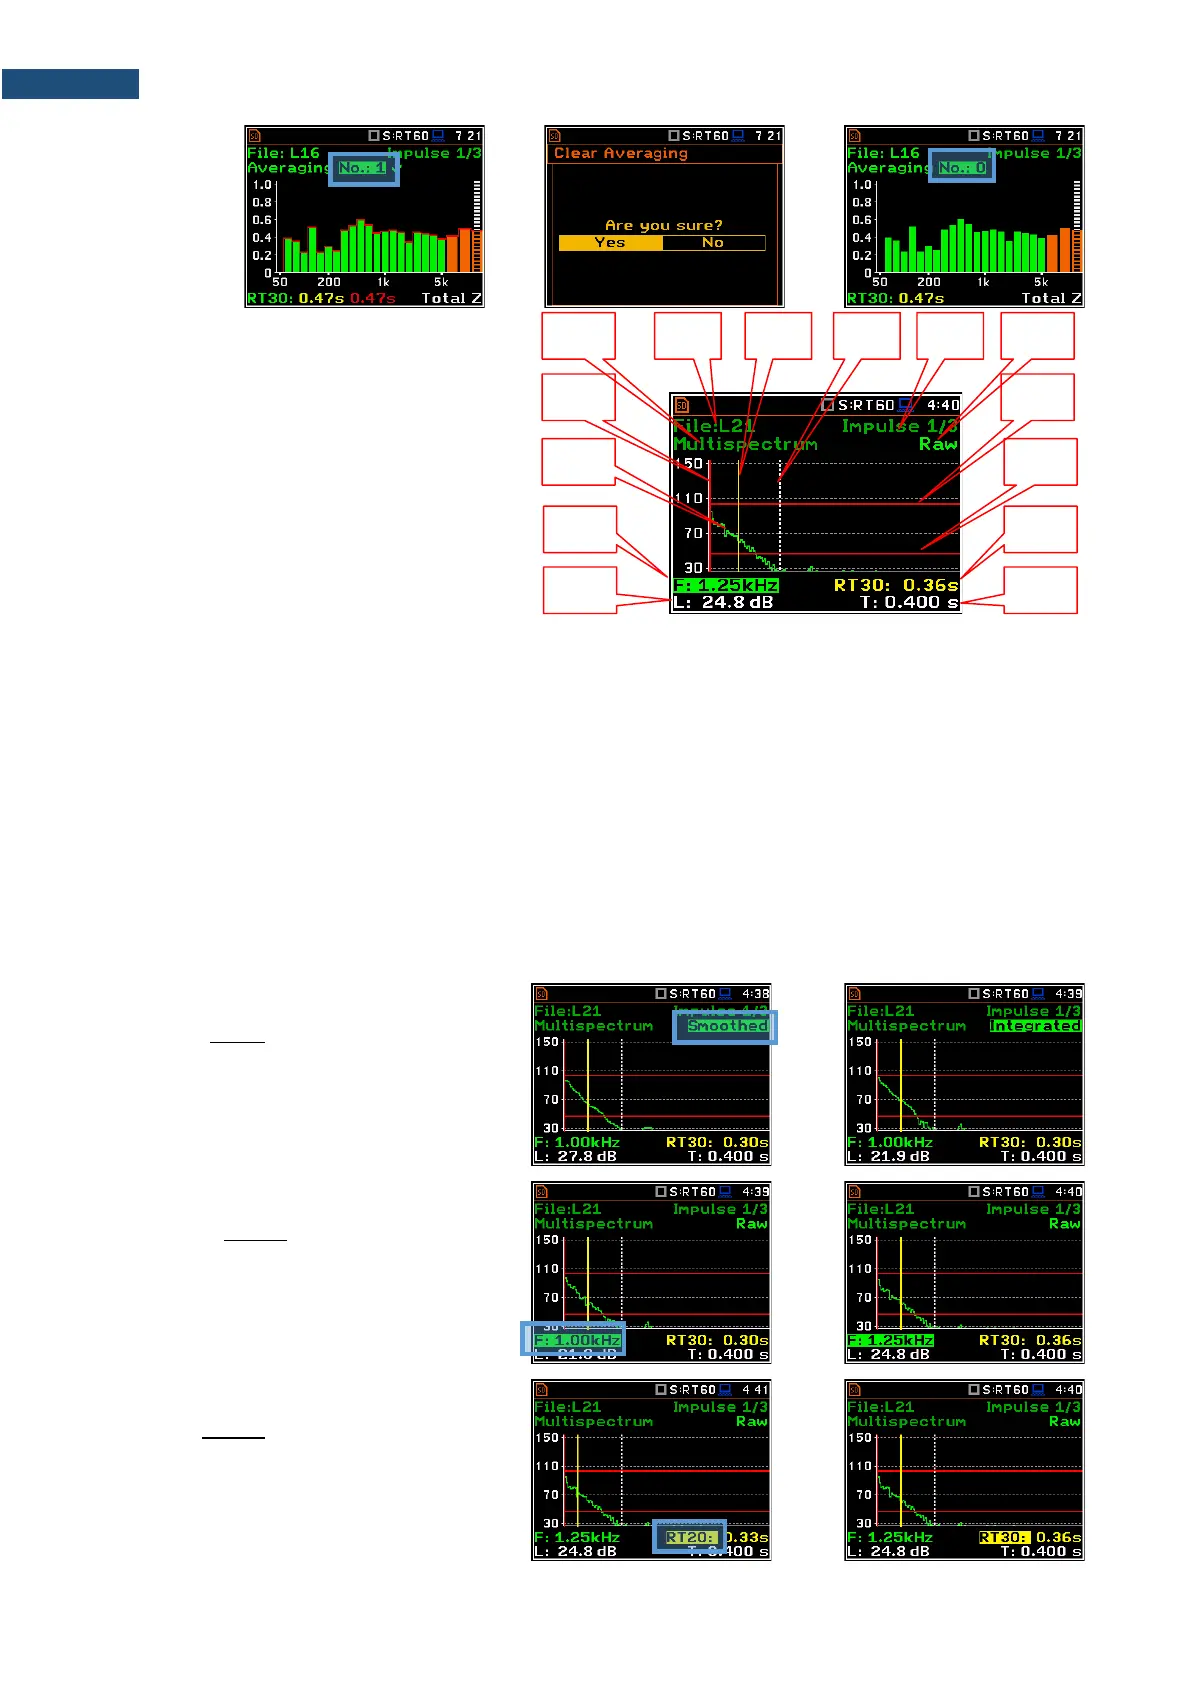
Sound pressure decay curve plot
1. Logger file content
2. T0 marker position
3. Decay curve plot
4. Central frequency of selected by cursor
1/3 octave band
5. Result value (SPL) for the cursor
position
6. Name of the logger file
7. T1 marker position
8. Cursor position
9. RT60 method
10. Type of data displayed: Raw,
Smoothed or Integrated
11. Calculated steady upper sound level
value
12. Calculated steady lower sound level
value
13. RT result (RT30, RT20, EDT and
RT User) with calculated reverberation
time
14. Cursor measurement time position
T0 marker position is used as a starting point to all three (and
the RT User also) reverberation time calculations.
On the display T1 marker position is labelled (indicator A7) as
EDT, RT20 or RT30 according to which the most restricted
definition of the RT condition is fulfilled.
Changing the data type
When the field 9 is active the type of data
displayed (Raw, Smoothed or Integrated)
can be changed with the ◄ / ► key pressed
together with <Alt>.
Changing the band
When the field 3 is active the central
frequency of the band can be changed with
the ◄ / ► key pressed together with <Alt>.
Changing the RT function
When the field 13 is active the RT60 analysis
function can be changed with the ◄ / ► key
pressed together with <Alt>.