Pure base versus mixed base QVs
Pure bases and mixed bases have the same probability of error for the associated
basecall (10
–q/10
). Note the following:
• High-quality pure bases typically have QVs of 20 or higher.
• The distribution of quality values for mixed bases diers dramatically from that
of pure bases.
• Mixed bases have a maximum QV of 20.
• Review all mixed base calls.
Quality values (QV) and probability of error (Pe)
QV
Pe QV Pe
1 79.0% 30 0.10%
5 32.0% 35 0.032%
10 10.0% 40 0.010%
15 3.2% 45 0.0032%
20 1.0% 50 0.0010%
25 0.32% 60 0.00010%
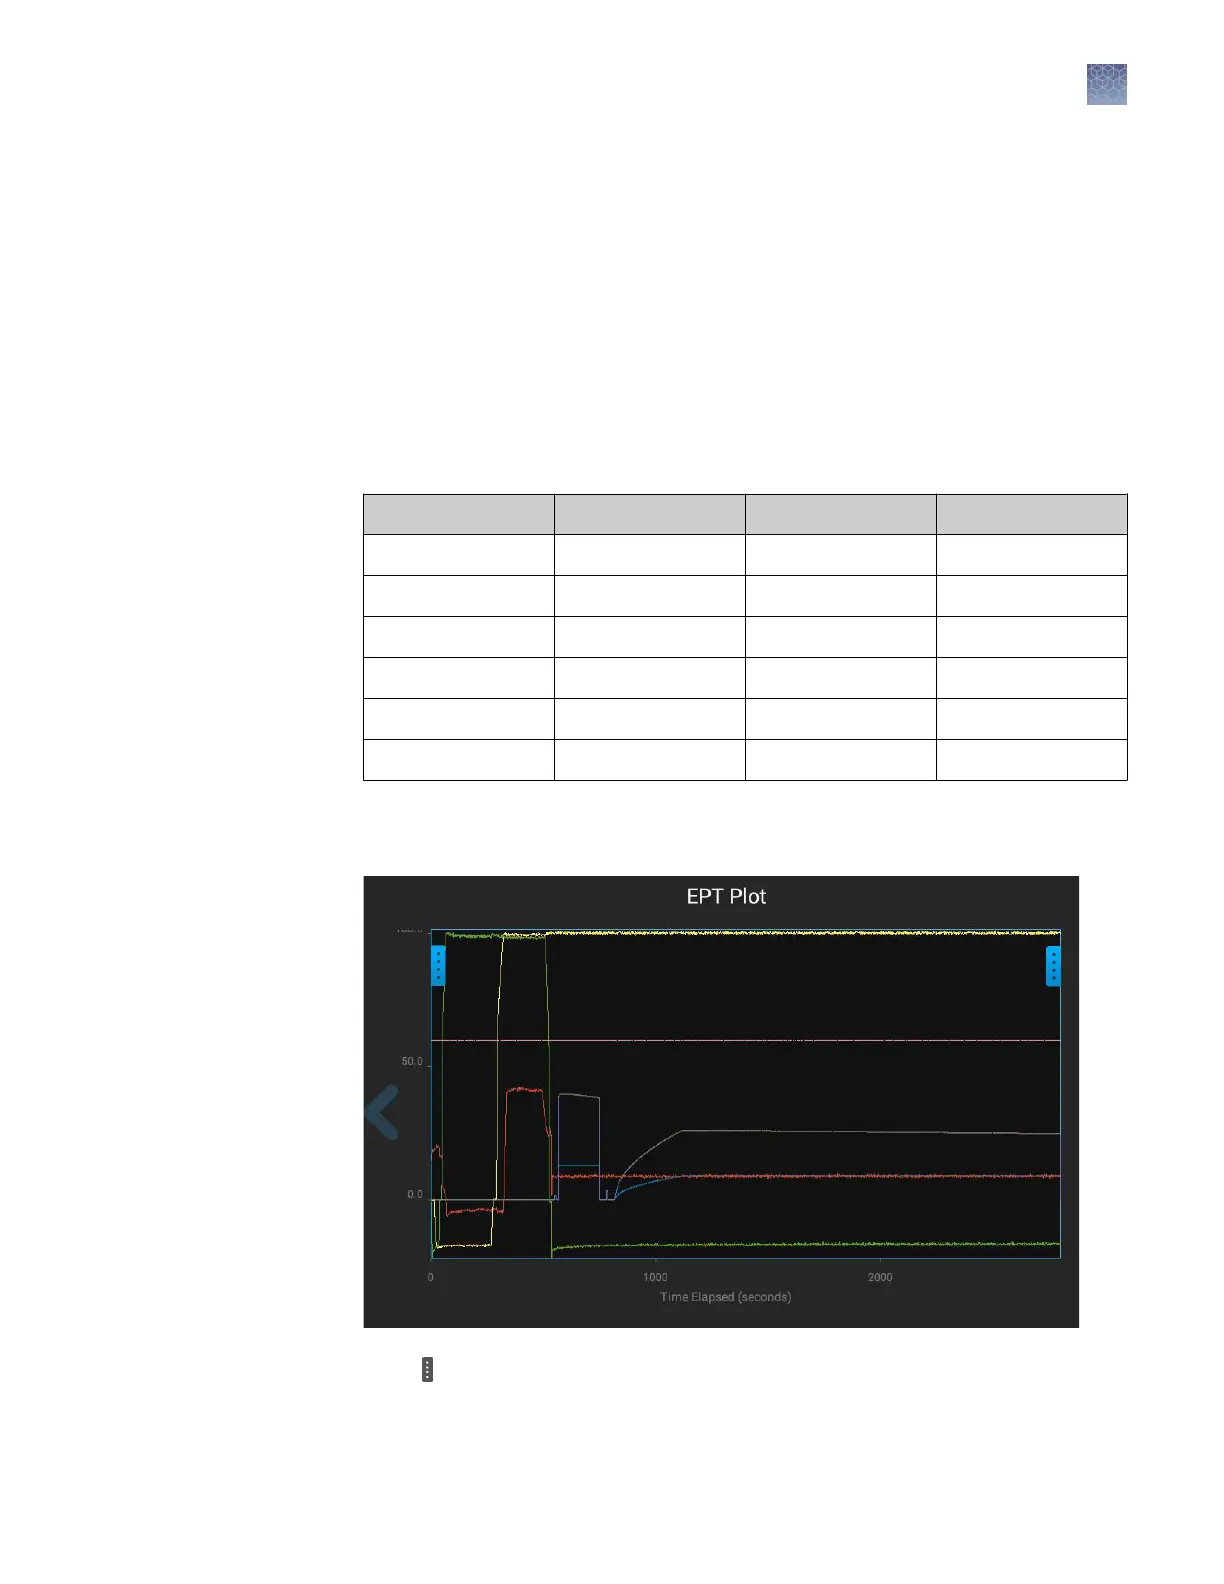
The EPT view (ElectroPhoresis Telemetry) shows instrument data conditions
(currents, temperatures, electrophoresis voltage) as a function of time.
Touch on the left border of the plot to display the legend.
EPT plot
Chapter 8 View and analyze results
View results on the instrument
8
SeqStudio
™
Genetic Analyzer Instrument and Software User Guide
117