Packet Size
The Web Manager allows packets received by the Switch, arranged in six groups and classed by size, to be viewed as
either a line graph or a table. Two windows are offered. To select a port to view these statistics for, select the port by
using the Port pull-down menu. The user may also use the real-time graphic of the Switch at the top of the web page
by simply clicking on a port.
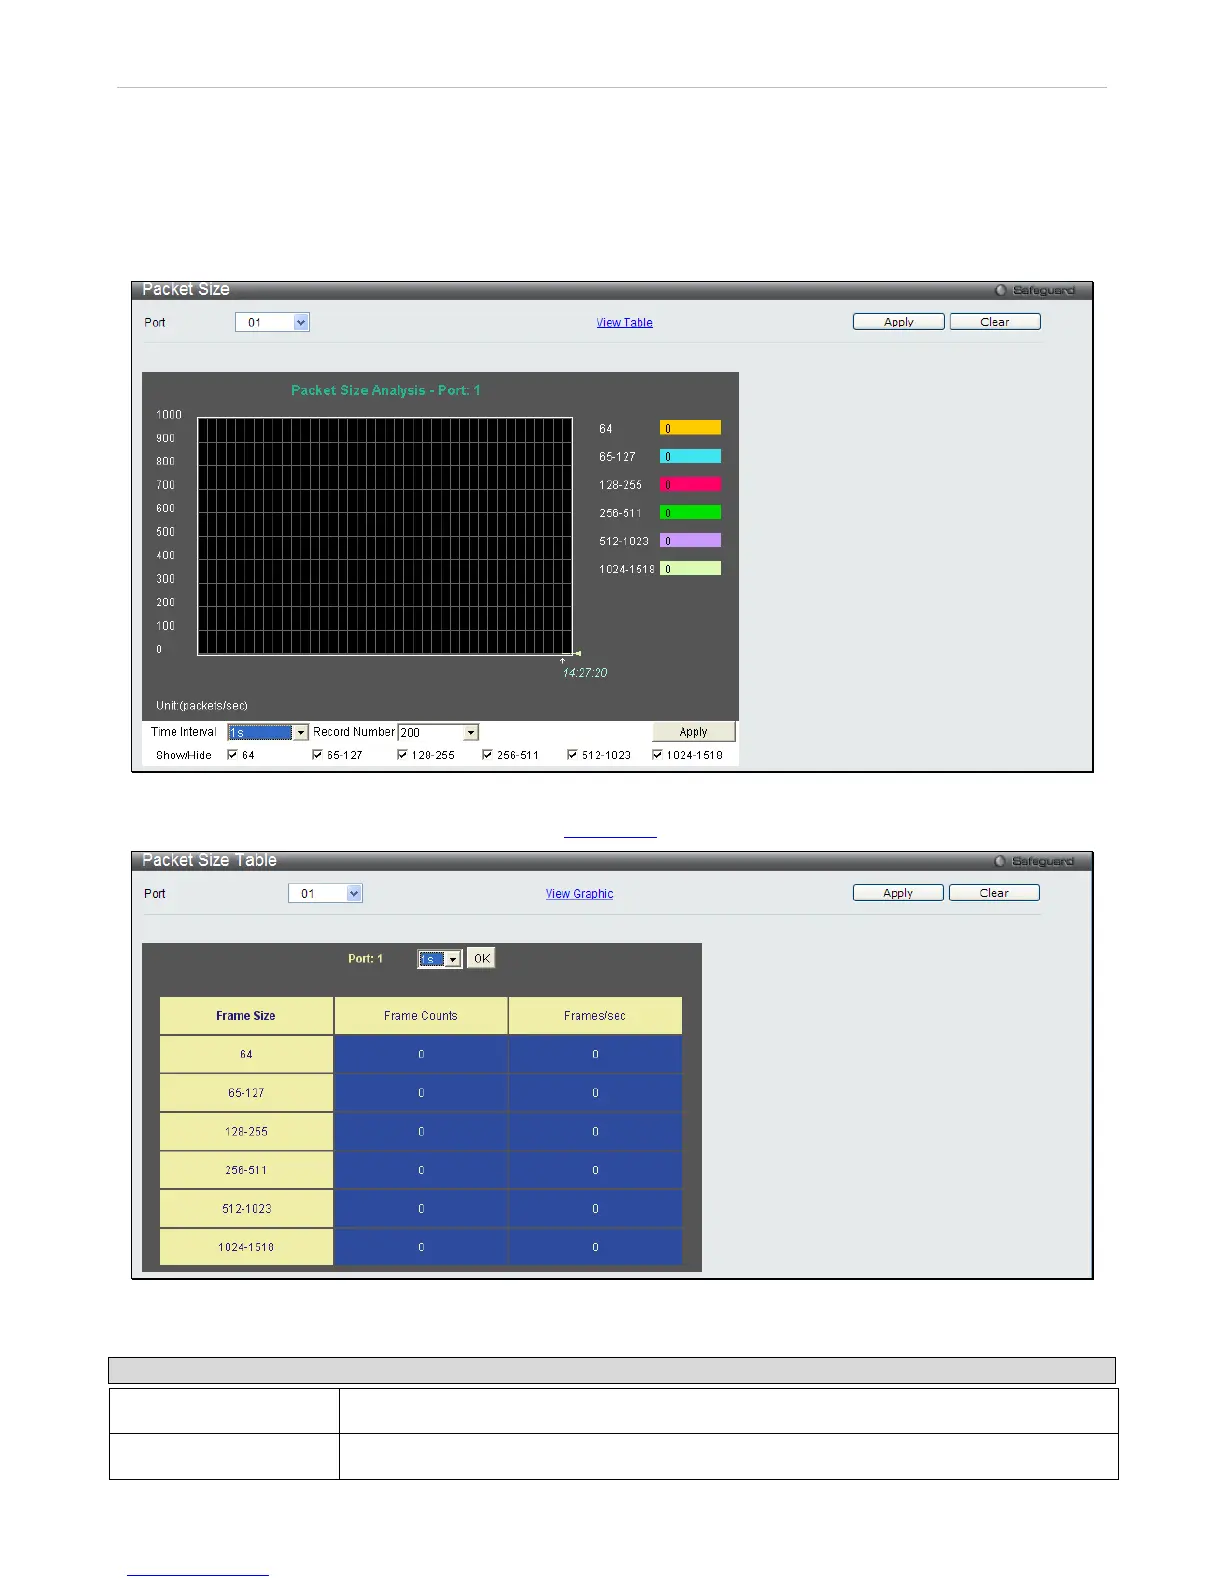
To view the packet size windows, click Monitoring > Packet Size
Figure 8 - 5 Packet Size window
To view the Packet Size Table window, click the link View Table
, which will show the following table:
Figure 8 - 6 Packet Size Table window
The following fields can be set or viewed:
Parameter Description
Port
Use the drop-down menu to choose the port that will display statistics.
Time Interval Select the desired setting between 1s and 60s, where "s" stands for seconds. The default