V00632
I
A1
I
B1
I
R1
-jX
C1
I
H1
I
A2
I
B2
I
R2
I
L
-jX
C2
jXL
I
H 2
I
A3
IB3
IC3 = IF
-jX
C3
I
R3
I
F
IH3
I
H1
+ I
H2
I
L
= I
F
+ I
H1
+ I
H2
+ I
H3
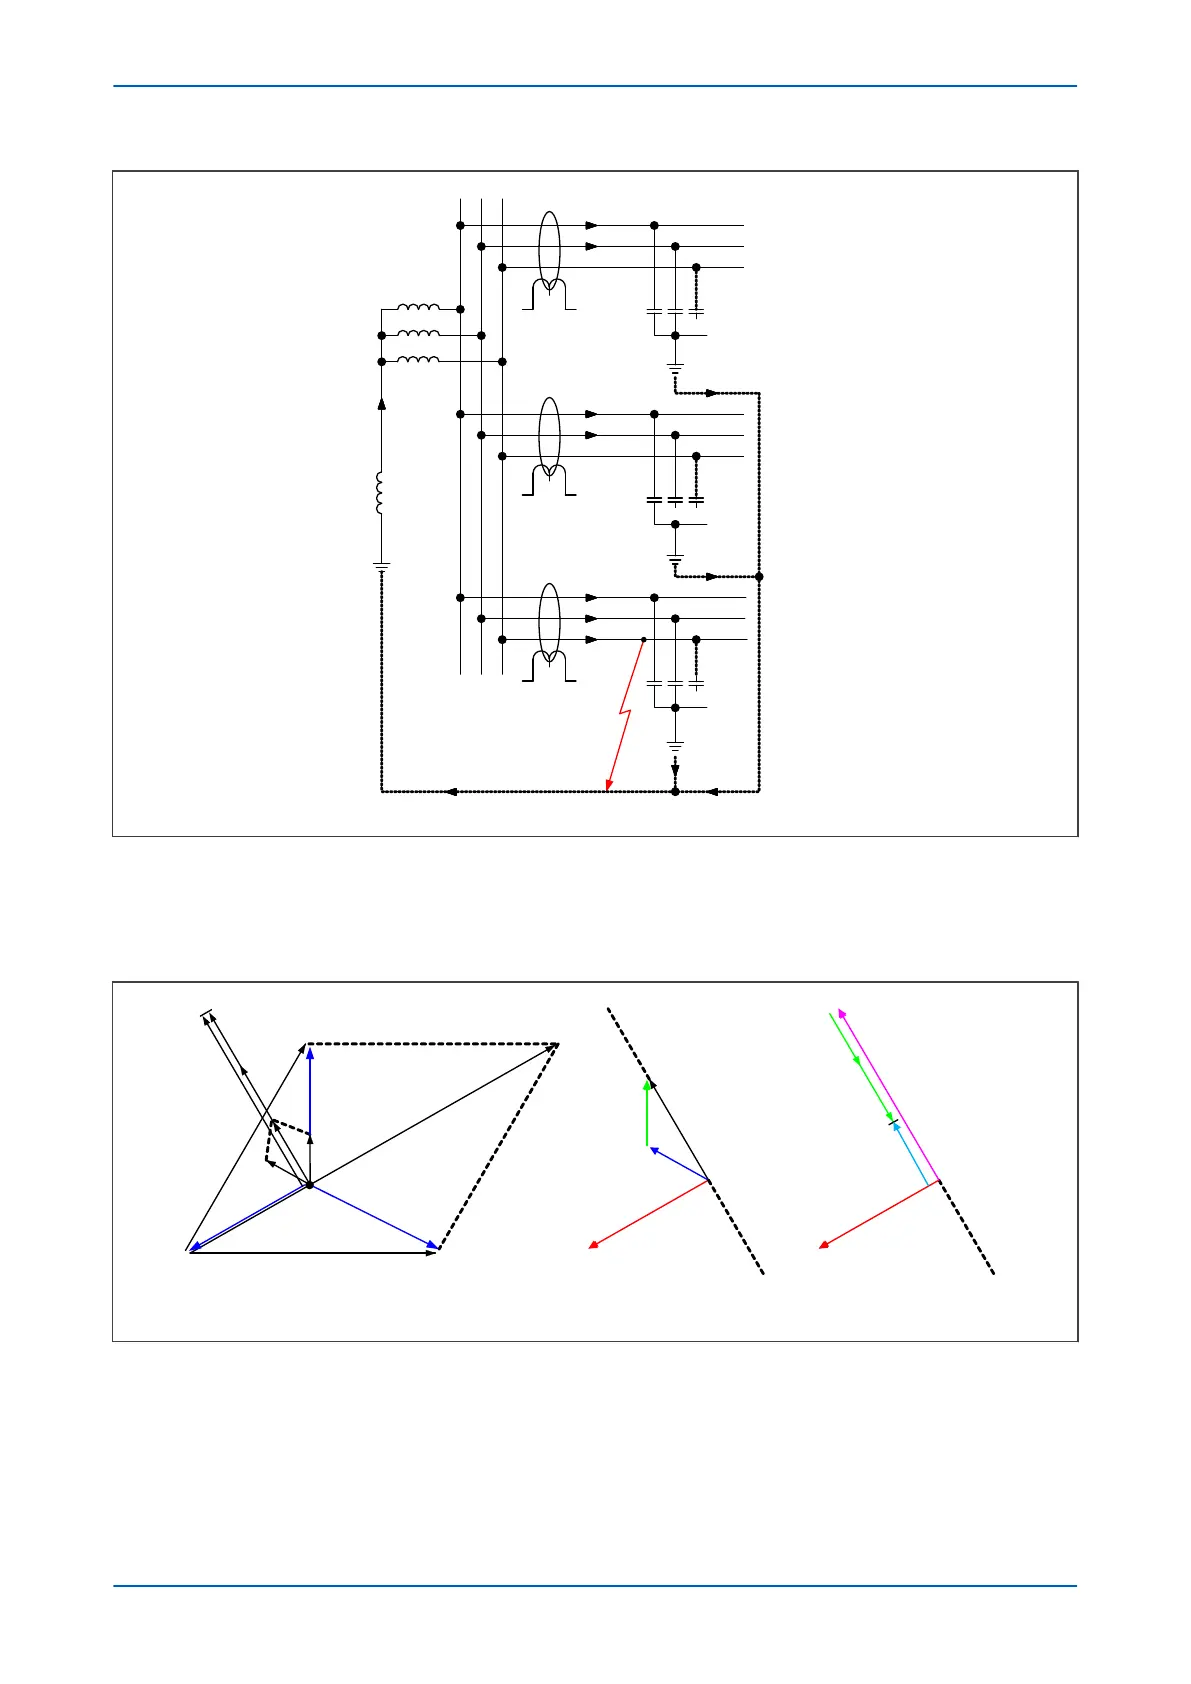
Figure 52: Distribution of currents during a C phase to earth fault
The figur
e below shows vector diagrams for the previous system, assuming that it is fully compensated (for
example, coil reactance fully tuned to system capacitance), in addition to assuming a theoretical situation where
no resistance is present either in the earthing coil or in the feeder cables.
V00633
V
res
= -3V
o
I
R1
= I
H1
I
a1
I
b1
V
res
= -3V
o
I
R3
= I
F
+ I
H3
I
L
-I
H1
-I
H2
I
R3
= I
L
- I
H1
- I
H2
a) Capacitive and inductive currents
C B
A 3V0
I
H3
I
H2
IL
I
H1
I
B1
IA1
N
b) Unfaulted line c) Faulted line
Figure 53: Theoretical case - no resistance present in XL or XC
W
ith reference to the associated vector diagram, it can be seen that the the C-phase to earth fault causes the
voltages on the healthy phases to rise by a factor of 3. The A phase charging currents (Ia1, Ia2 and Ia3), are then
shown to be leading the resultant A phase voltage by 90° and likewise for the B phase charging currents with
respect to the resultant Vb.
Chapter 6 - Current Protection Functions P24xM
126 P24xM-TM-EN-2.1