Operation - Monitoring Your Recorder
124 DR4500A Classic Series Circular Chart Recorder With or Without Control Product Manual Release M
April 2017
Reading the deviation bargraph
In addition to the indicators, a bargraph containing 21 bars displays Process Variable (PV) deviation from
Setpoint (SP).
When CHN “1” indicator is lit, the bargraph display applies for Controller #1. It applies for
Controller #2 when CHN “2” indicator is lit. Sequentially press the LOWR DISP key to light the
appropriate CHN indicator (1 or 2) and view the corresponding controller displays.
The green “on-control” bar lights when the PV is within ±1% of setpoint.
The 10 small green bars above the “on-control” bar light for each positive deviation up to +10% and the
10 below light for each negative deviation down to –10%. If the process deviation is greater than ±10%,
the “on-control” bar and the specific small green bars light.
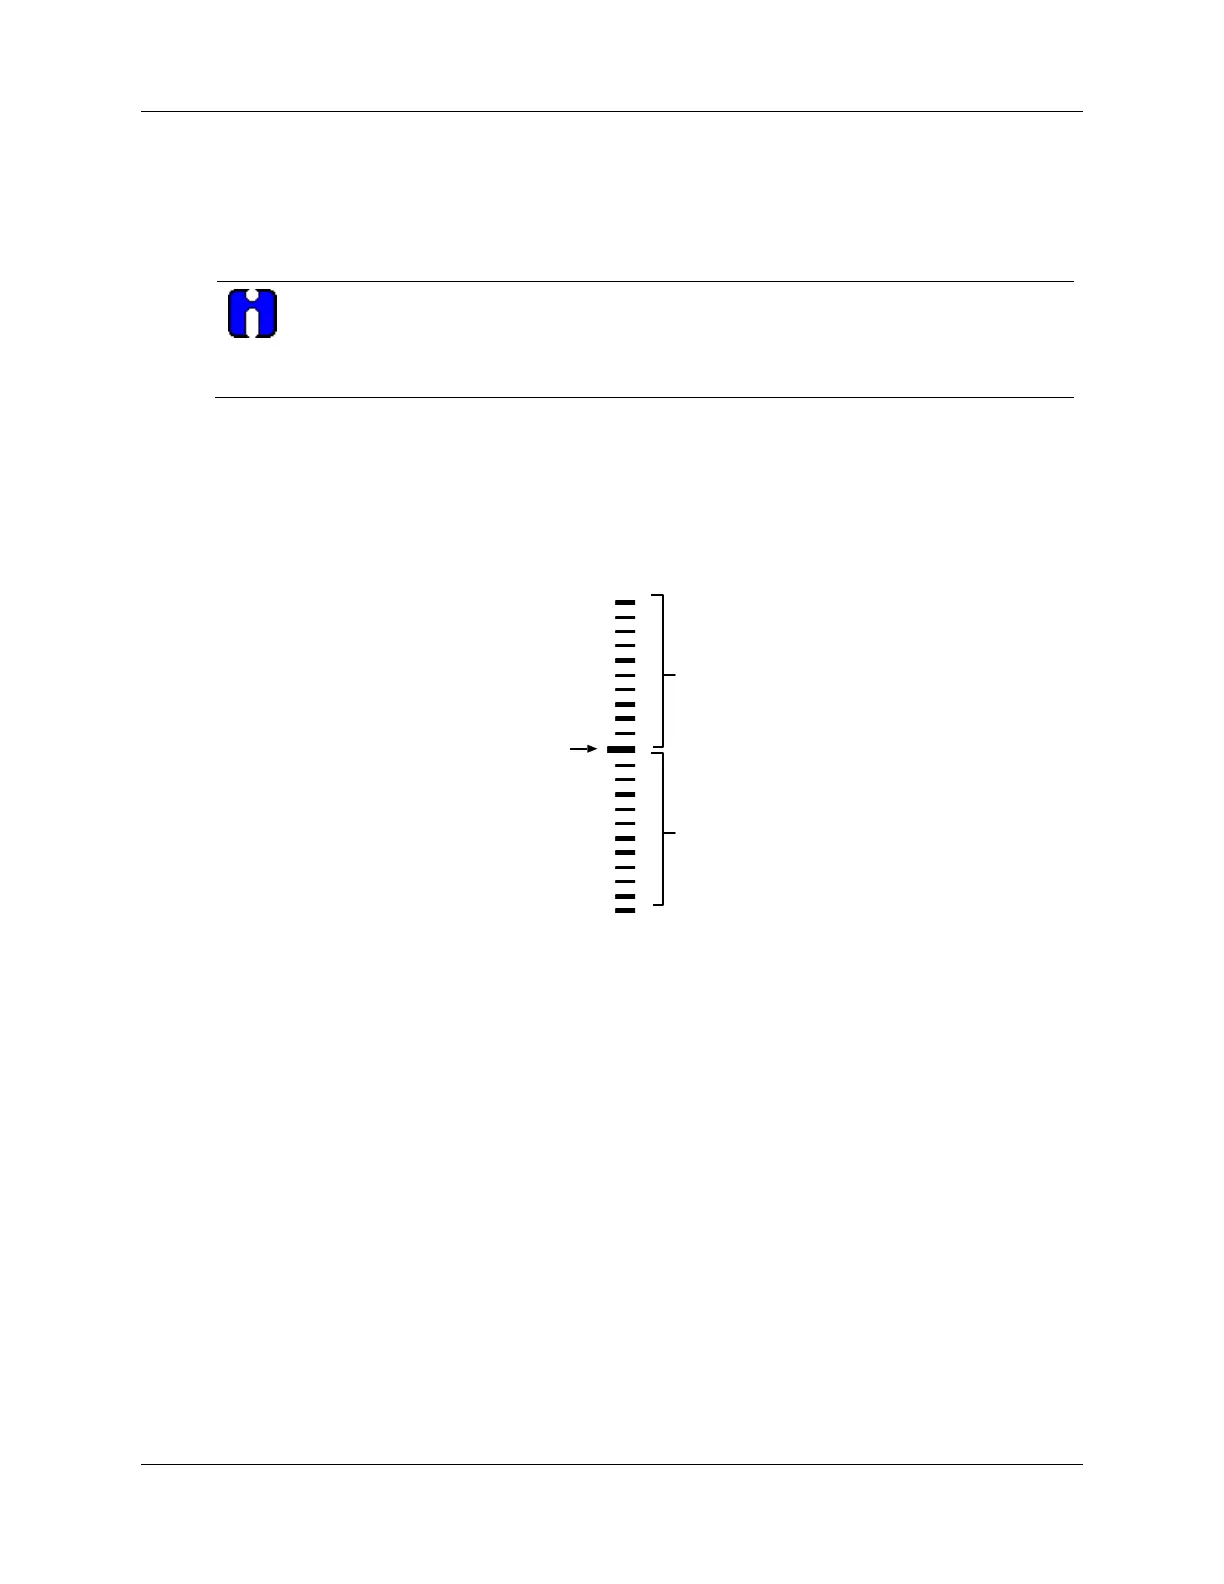
65HFigure 5-3 shows how the deviation bargraph works.
+1 to +10%
small green
deviation bars
21424
-1 to -10%
small green
deviation bars
Green
"on control"
bar
Figure 5-3 Deviation bargraph