v 2.3 — September 2015 Altanium Delta3
92 Temperature Graphs Screen
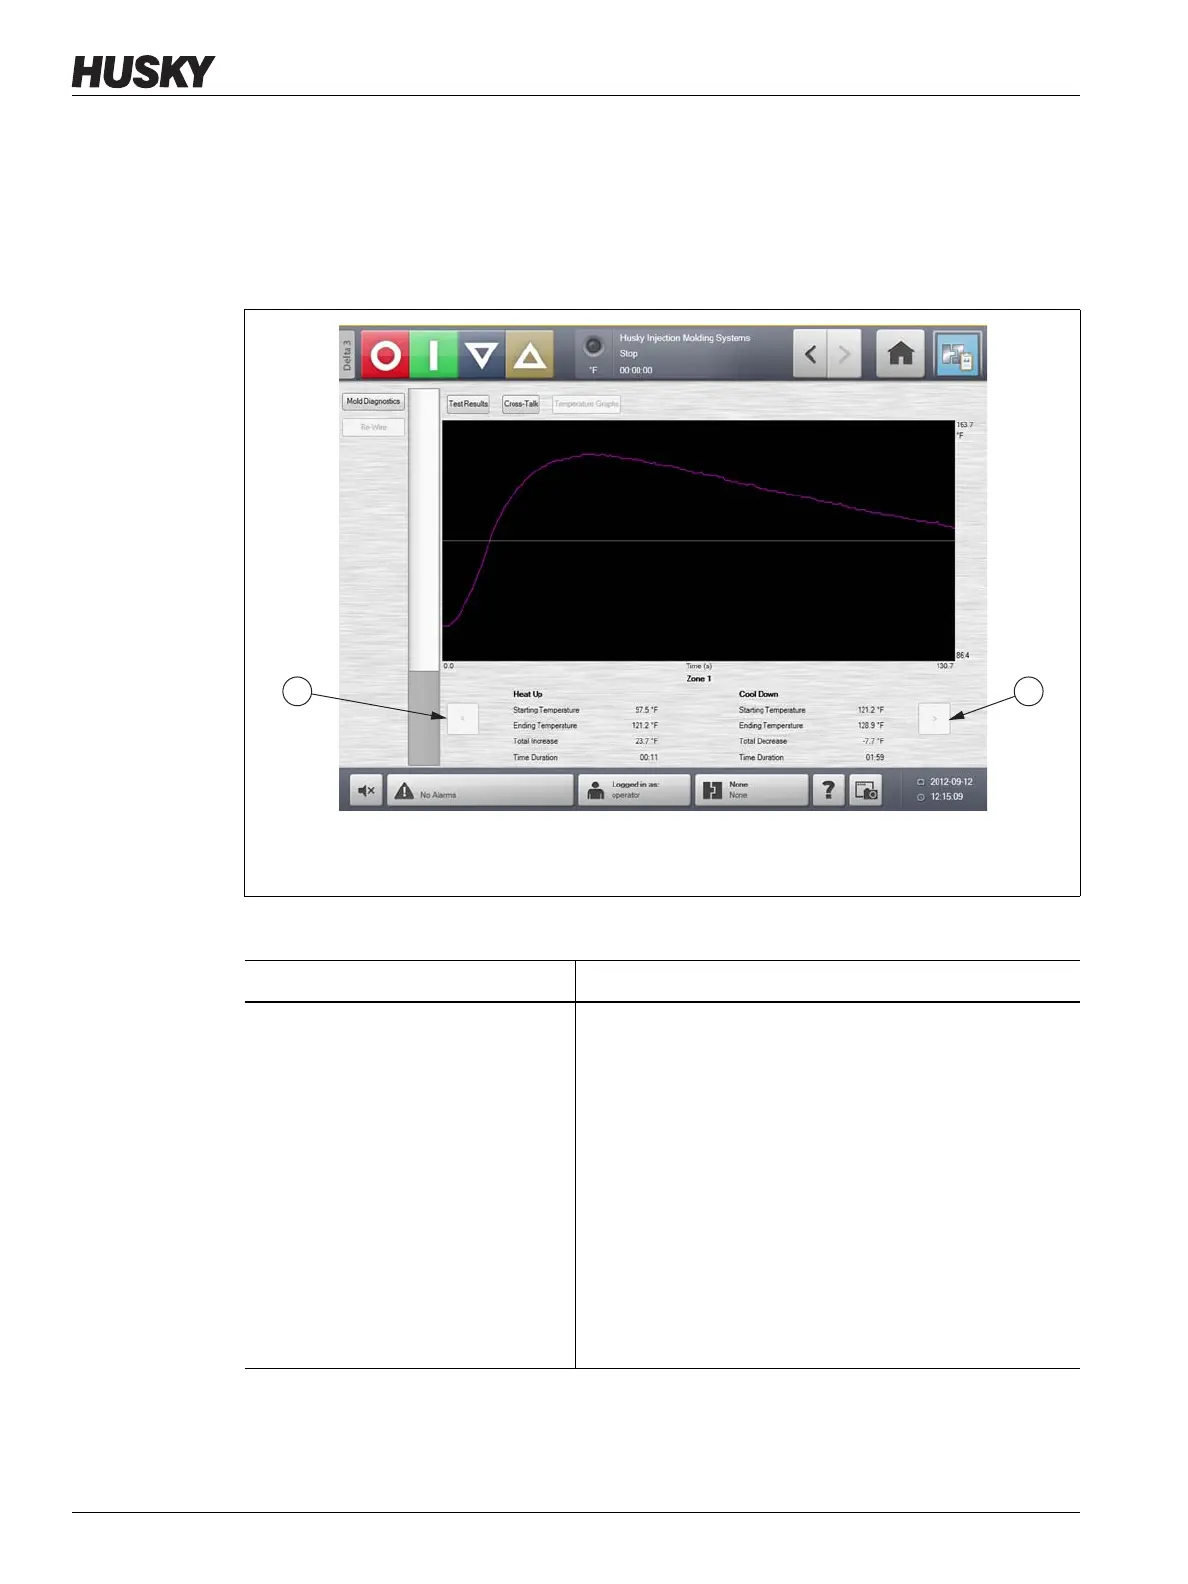
8.4 Temperature Graphs Screen
On the Diagnostics Results screen, touch the Temperature Graphs button to open the
Temperature Graphs screen. The Temperature Graphs screen displays a trace for each
zone tested that represents the temperature rise over the duration of the test.
Figure 8-4 Temperature Graphs Screen
1. Previous Button 2. Next Button
Table 8-2 Temperature Graphs Screen Item Descriptions
Item Description
Temperature Graph The temperature graph displays the recorded temperature
rise over the duration of the test period for the selected
zone. Touch the graph line to display the temperature and
status of the location touched.
• The purple graph line zone information is displayed in
the Heat Up and Cool Down portion of the
Temperature Graphs screen. Use the Previous and
Next buttons to change which zone is displayed as a
purple graph line.
• The grey graph line indicates the zone for which the
information can be displayed on the Heat Up and
Cool Down portion of the Temperature Graphs
screen using the Previous and Next buttons.