8.7 Titer determination options and data
■■■■■■■■■■■■■■■■■■■■■■
60
■■■■■■■■
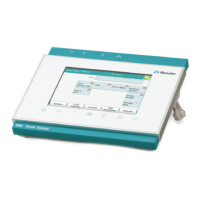
900 Touch Control
NOTICE
If multiple determinations have been carried out in order to determine
the titer, then only one entry will be made in the history.
[Delete History]
Delete the entire history.
[Graph]
Open the diagram of the titer values, see following chapter.
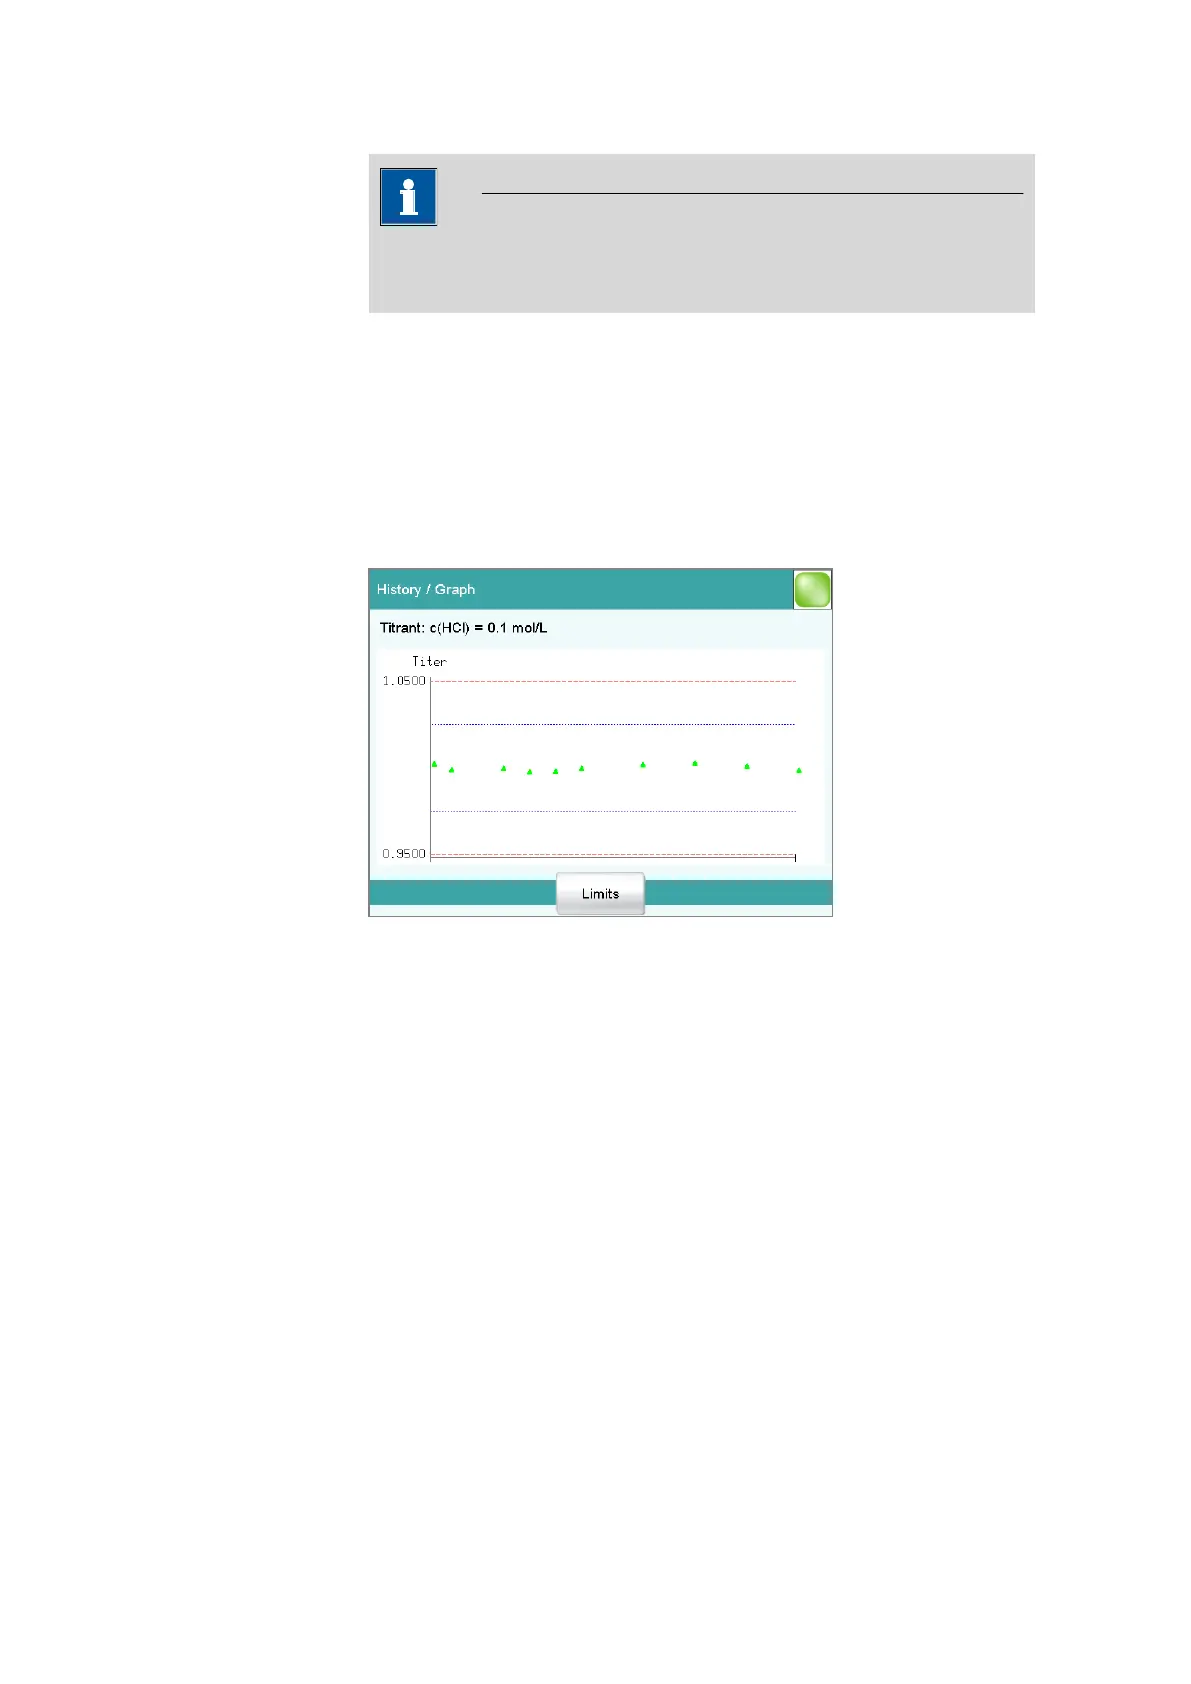
Dialog "History / Graph"
Titrant: Edit ▶ Titer options ▶ History ▶ Graph
In this diagram, titer values are plotted against the date of the titer deter-
mination. You can define warning limits (blue dashed lines) and interven-
tion limits (red dashed lines). These limits will not, however, be monitored.
[Limits]
Define warning and intervention limits.