27.3 List of all printable reports
■■■■■■■■■■■■■■■■■■■■■■
246
■■■■■■■■
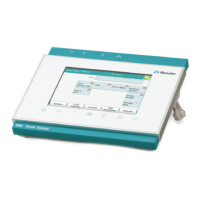
900 Touch Control
■ Result table
Definition of the time at which the report is to be printed (with each
determination, at the end of a sample series or at the end of the sam-
ple table).
■ Used devices
■ Variables
■ Monitoring
27.3 List of all printable reports
The following reports can be printed out with the fixed key [ ]:
NOTICE
If you have selected a CUSTOM NEOS printer, you can print only the
reports that are marked with a # on the display.
Report
Contents
Result report # Report with determination properties, sample data, calcu-
lated results, etc. If there are multiple determinations, the
statistics will also be printed out.
Curve # Curve report. The settings for the curve print-out are adop-
ted from the curve options of the live display.
Measuring point list # Measuring point list report.
Calculations # Details concerning the calculations carried out (parameter
settings in accordance with the CALC command and the
calculated results).
Used devices The devices used for the determination, as displayed in the
More determination data / Properties dialog.
Variables All determination variables, as displayed in the results dia-
log.
Monitoring Details for the monitored quantities (STAT, DOS only).
Statistics
Statistics short # Summary of the statistics calculations. The number of
determinations, the mean value, and the absolute and rela-
tive standard deviations are printed out for each result.