■■■■■■■■■■■■■■■■■■■■■■
10 Sensors
900 Touch Control
■■■■■■■■
73
ually entered calibration data will be displayed in black with the designa-
tion (m).
[Delete History]
Delete the entire history.
[Graph slope]
Open the diagram of the electrode slopes, see following chapter.
[Graph pH(0)]
Open the diagram of the electrode zero points, see following chapter.
[Graph E(0)]
Open the diagram of the electrode zero points, see following chapter.
[Graph cell const.]
Open the diagram of the cell constants, see following chapter.
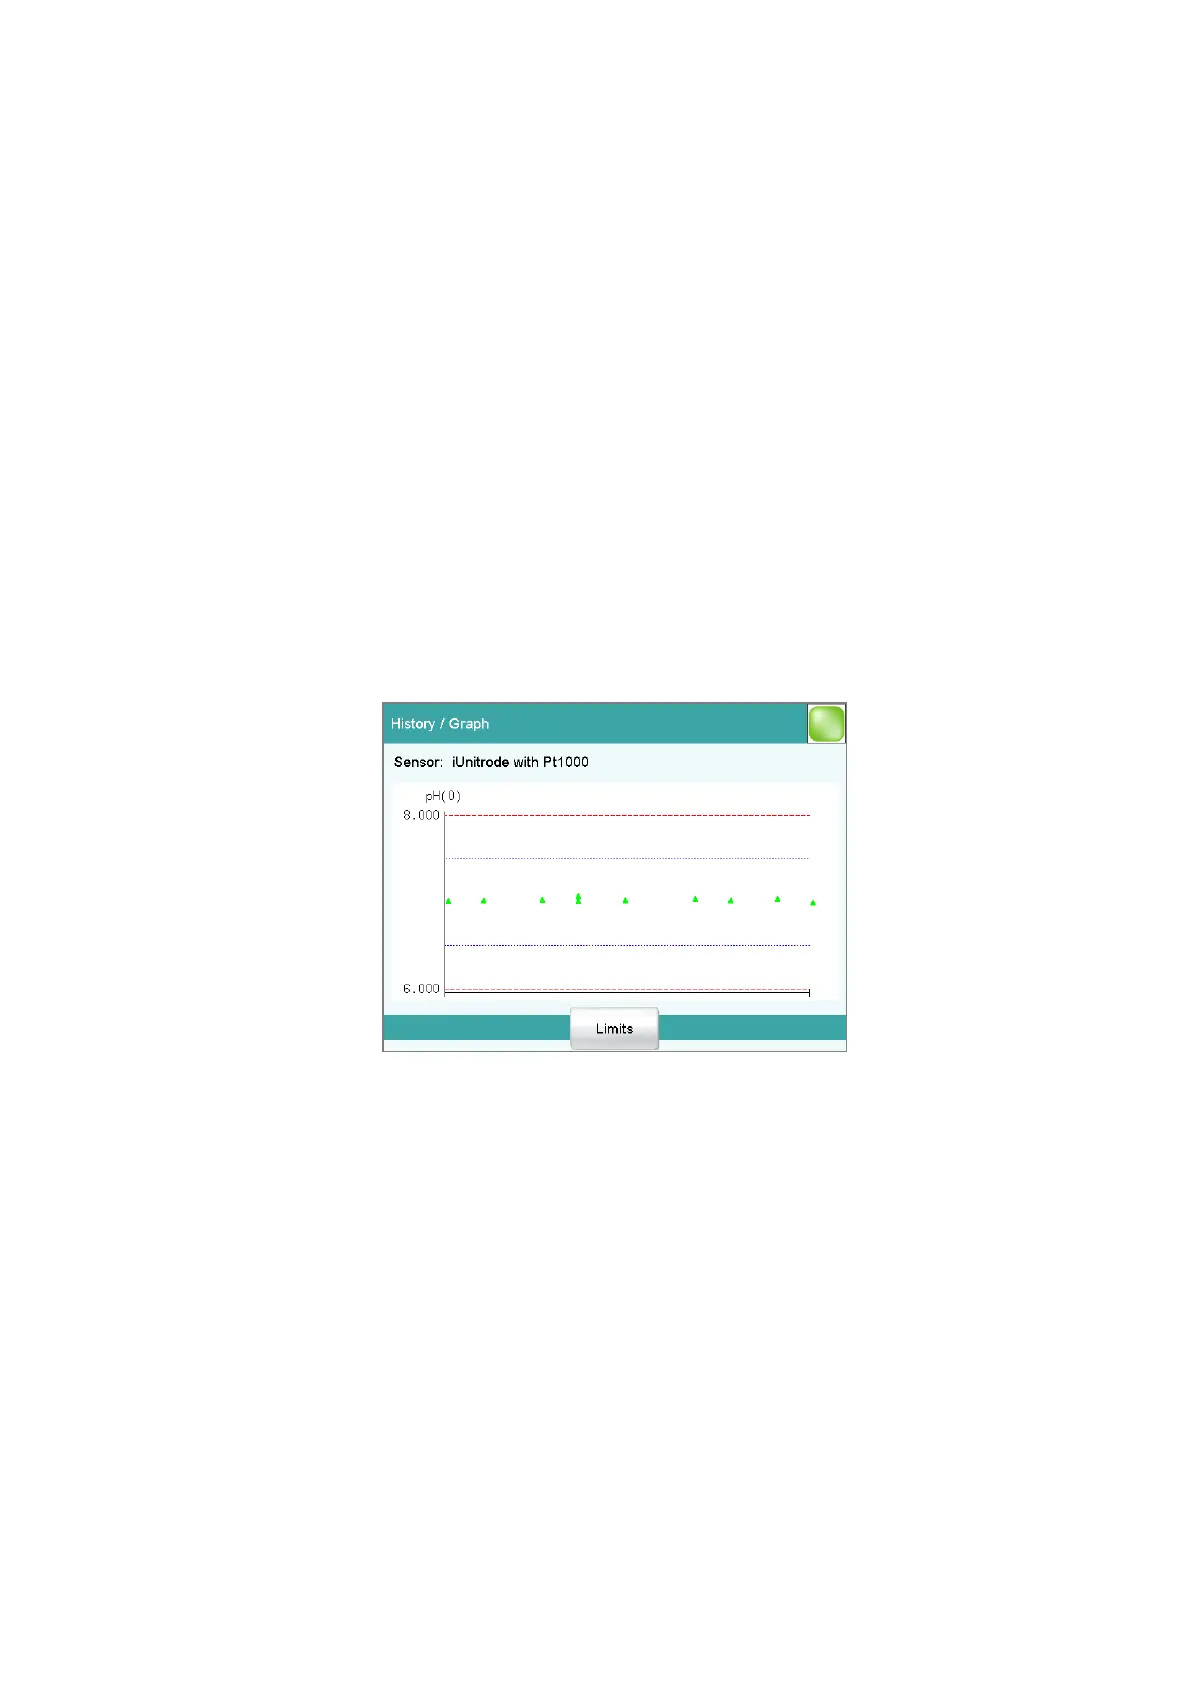
Dialog "History / Graph"
Sensor: Edit ▶ Calibration data ▶ History ▶ Graph Slope / pH(0) /
E(0) / Cell const.
In this diagram, either slope, pH(0), E(0) or the cell constant is plotted
against the date of the calibration. You can define warning limits (blue
dashed lines) and intervention limits (red dashed lines). These limits will
not, however, be monitored.
[Limits]
Define warning and intervention limits.
Dialog "Calibration data / GLP test"
Sensor: Edit ▶ Calibration data ▶ GLP test
In the dialog Calibration data / GLP test, you can define the time inter-
val after which a GLP test must be carried out again for the sensor.