VNA concepts and features
R&S
®
ZNL/ZNLE
213User Manual 1178.5966.02 ─ 20
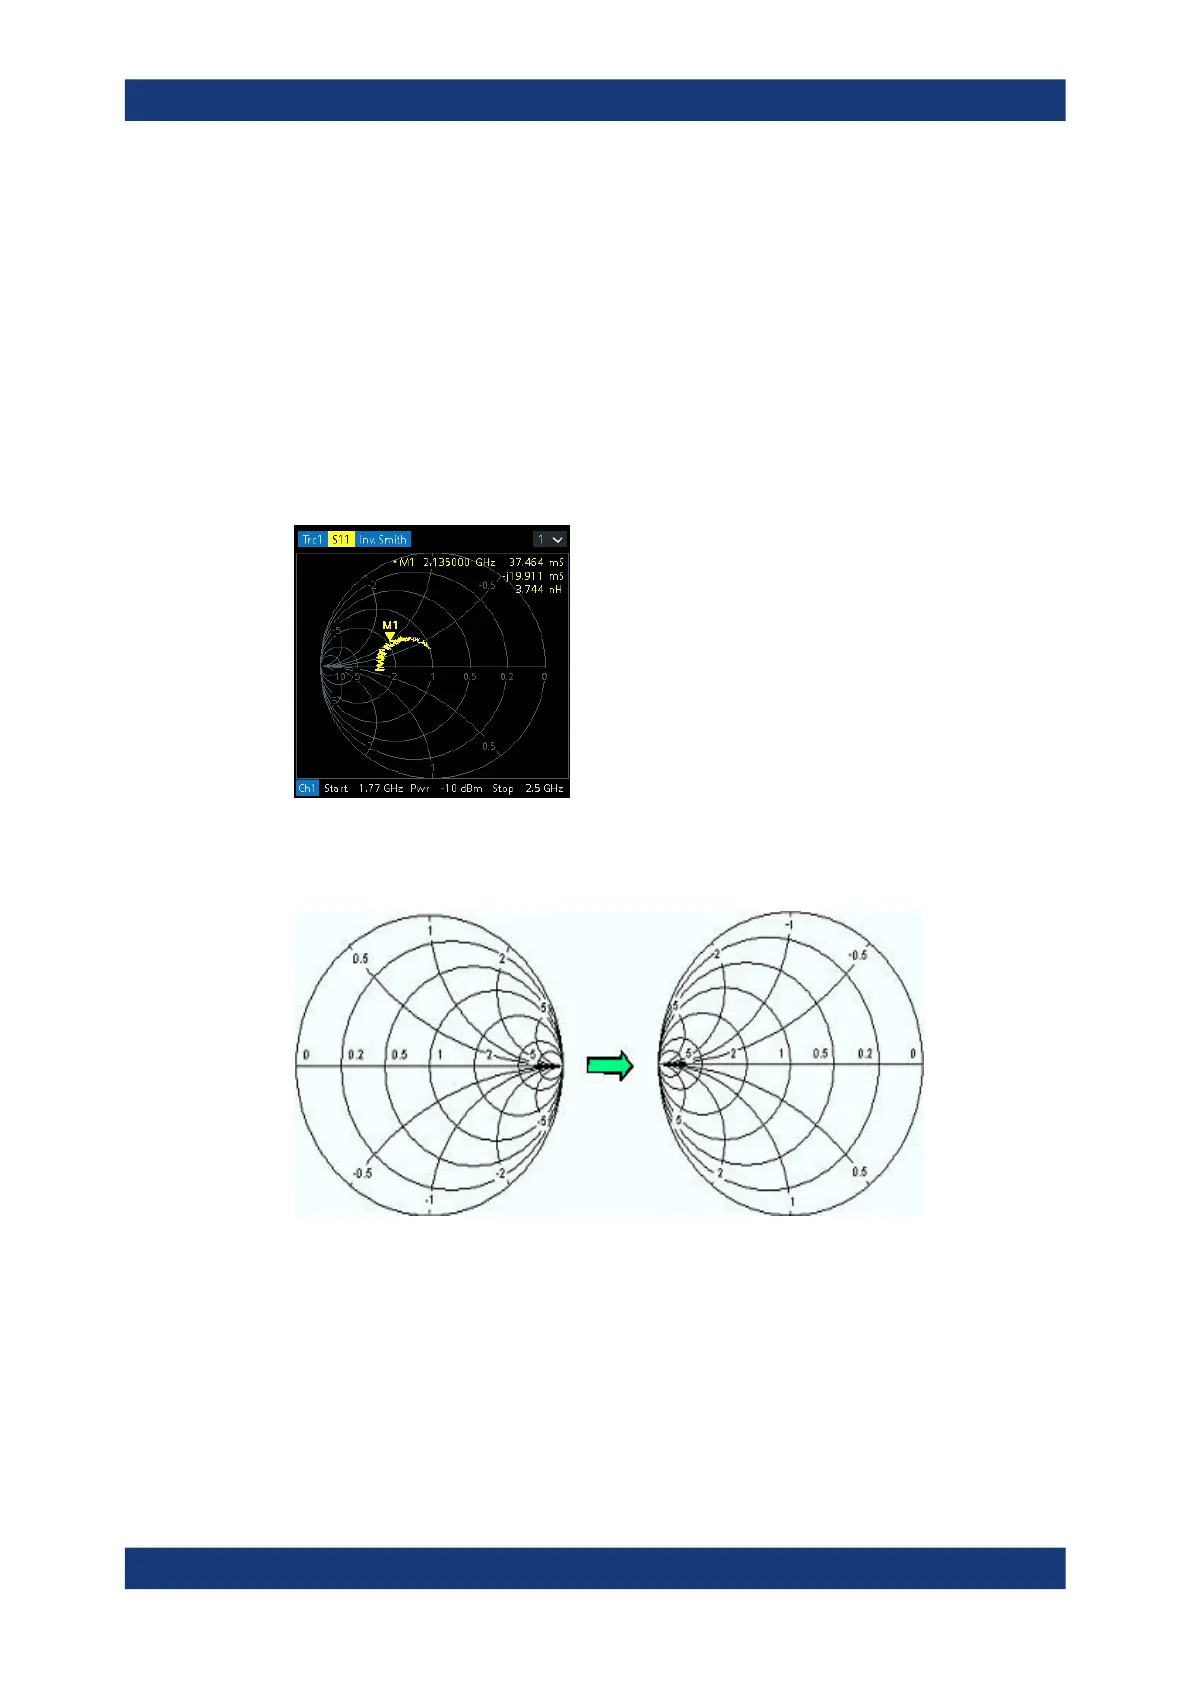
Inv Smith
For "Inv Smith" formatted traces, the response values are interpreted as complex
reflection coefficients S
ii
and represented in terms of their corresponding complex
admittance Y(S
ii
) = G(S
ii
) + j B(S
ii
).
In a diagram, the grid lines overlaid to a "Smith" trace correspond to points of equal
conductance G and susceptance B:
●
Points with the same conductance are located on circles.
●
Points with the same susceptance produce arcs.
The following example shows an inverted Smith chart with a marker used to display the
stimulus value, the complex admittance Y = G + j B and the equivalent inductance L.
Inverted Smith chart construction
The inverted Smith chart is point-symmetric to the Smith chart:
The basic properties of the inverted Smith chart follow from this construction:
●
The central horizontal axis corresponds to zero susceptance (real admittance). The
center of the diagram represents Y/Y
0
= 1, where Y
0
is the reference admittance of
the system (zero reflection). At the left and right intersection points between the
horizontal axis and the outer circle, the admittance is infinity (short) and zero
(open).
●
The outer circle corresponds to zero conductance (purely imaginary admittance).
Points outside the outer circle indicate an active component.
VNA screen elements

 Loading...


