Getting Started
R&S
®
ZNL/ZNLE
57User Manual 1178.5966.02 ─ 20
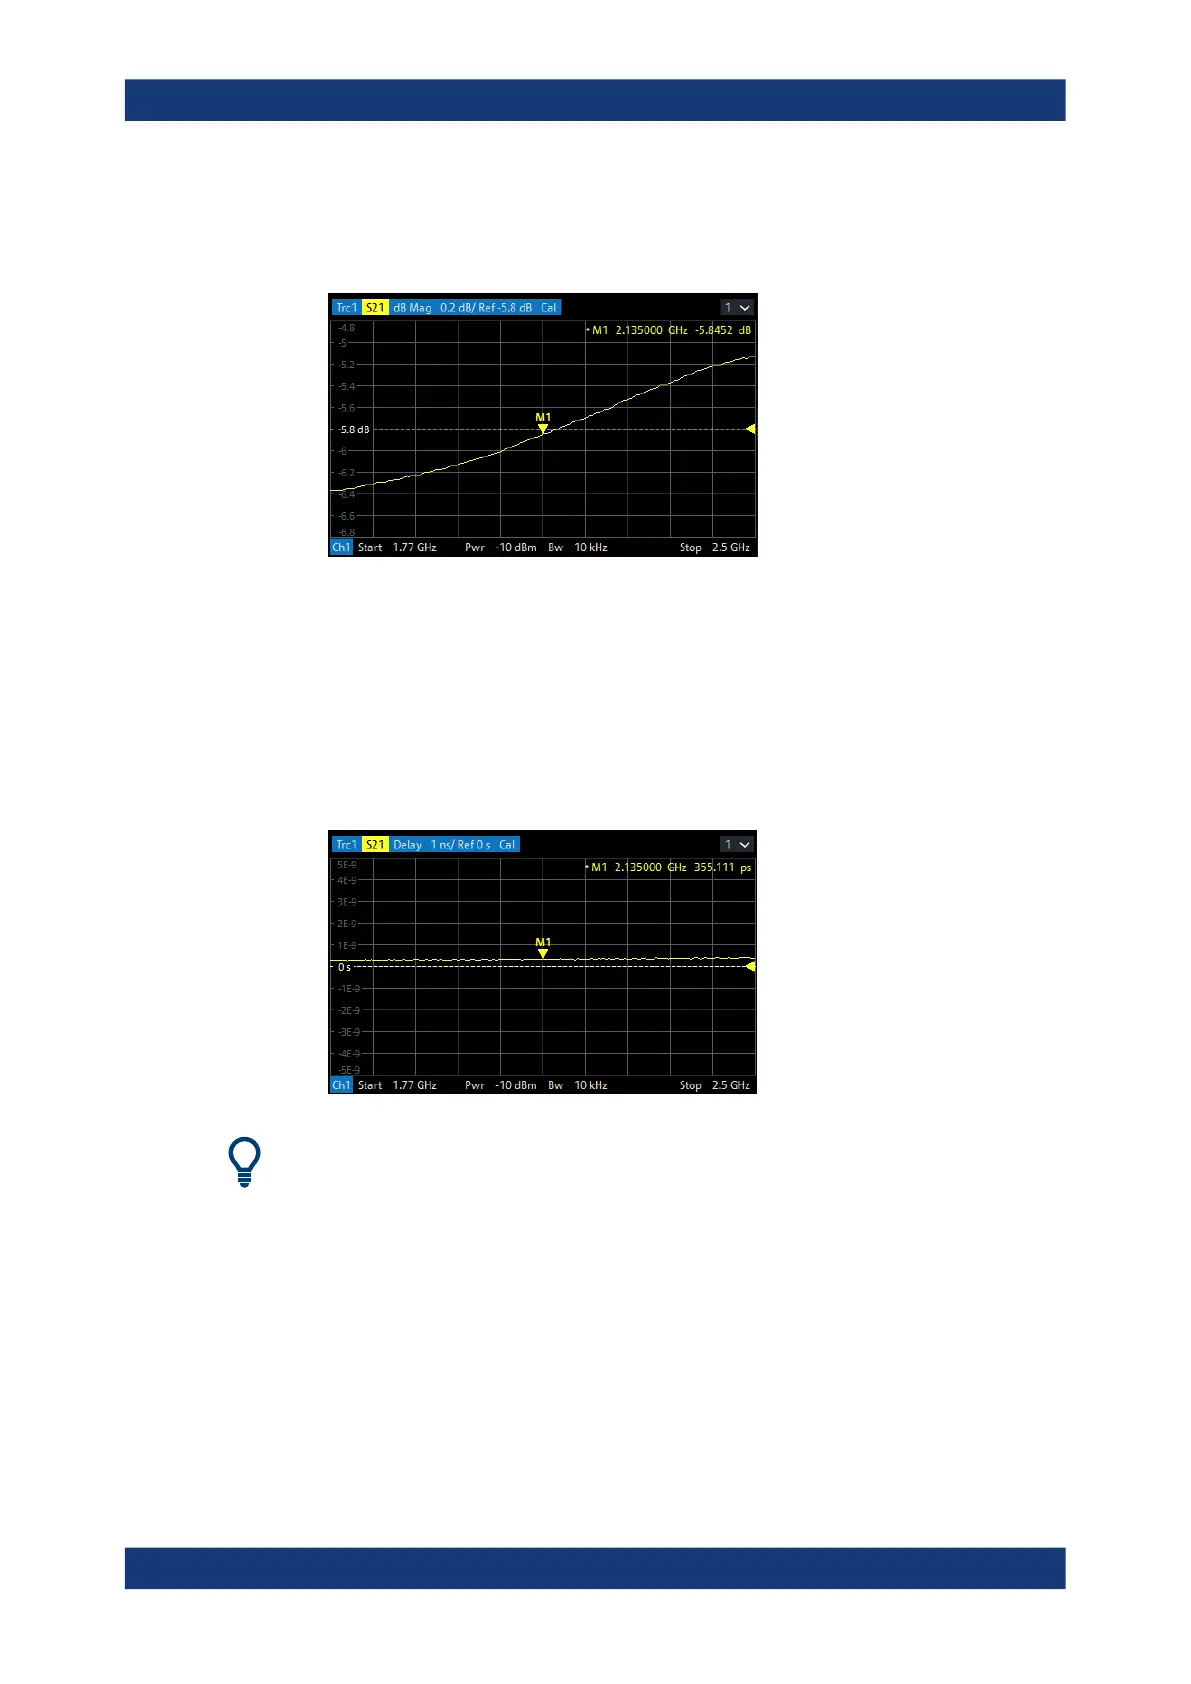
corner of the diagram. The marker info field displays the stimulus value (frequency)
and response value (magnitude of the transmission coefficient converted to a dB
value) at the marker position.
2. Open the [Mkr->] > "Peak" softtool tab and activate "Min" search.
The marker jumps to the absolute minimum of the curve in the entire sweep range.
The marker info field shows the coordinates of the new marker position.
3. Select [Format] and choose the "Delay" of the transmission coefficient as displayed
quantity.
The group delay represents the propagation time of the wave through the DUT; it is
displayed in a Cartesian diagram. The marker info field shows the frequency and
group delay at the marker position.
Refer to Chapter 9.2.3, "Trace formats", on page 207 to learn more about the diagram
properties.
4.3.1.2 Reflection S-parameter measurement
In a reflection measurement, the analyzer transmits a stimulus signal to the input port
of the device under test (DUT) and measures the reflected wave. Different trace for-
mats allow you to express and display the results, depending on what you want to
learn from the data. Only one analyzer test port is required for reflection measure-
ments.
Trying out the instrument

 Loading...


