Operating displays
ENVI-MAG Manual A3-17
Instrument
Basic mode data collection displays
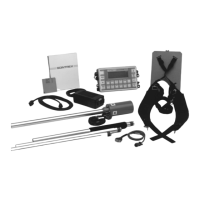
The display screen during data collection is as follows:
Figure A-16
Data collection displays
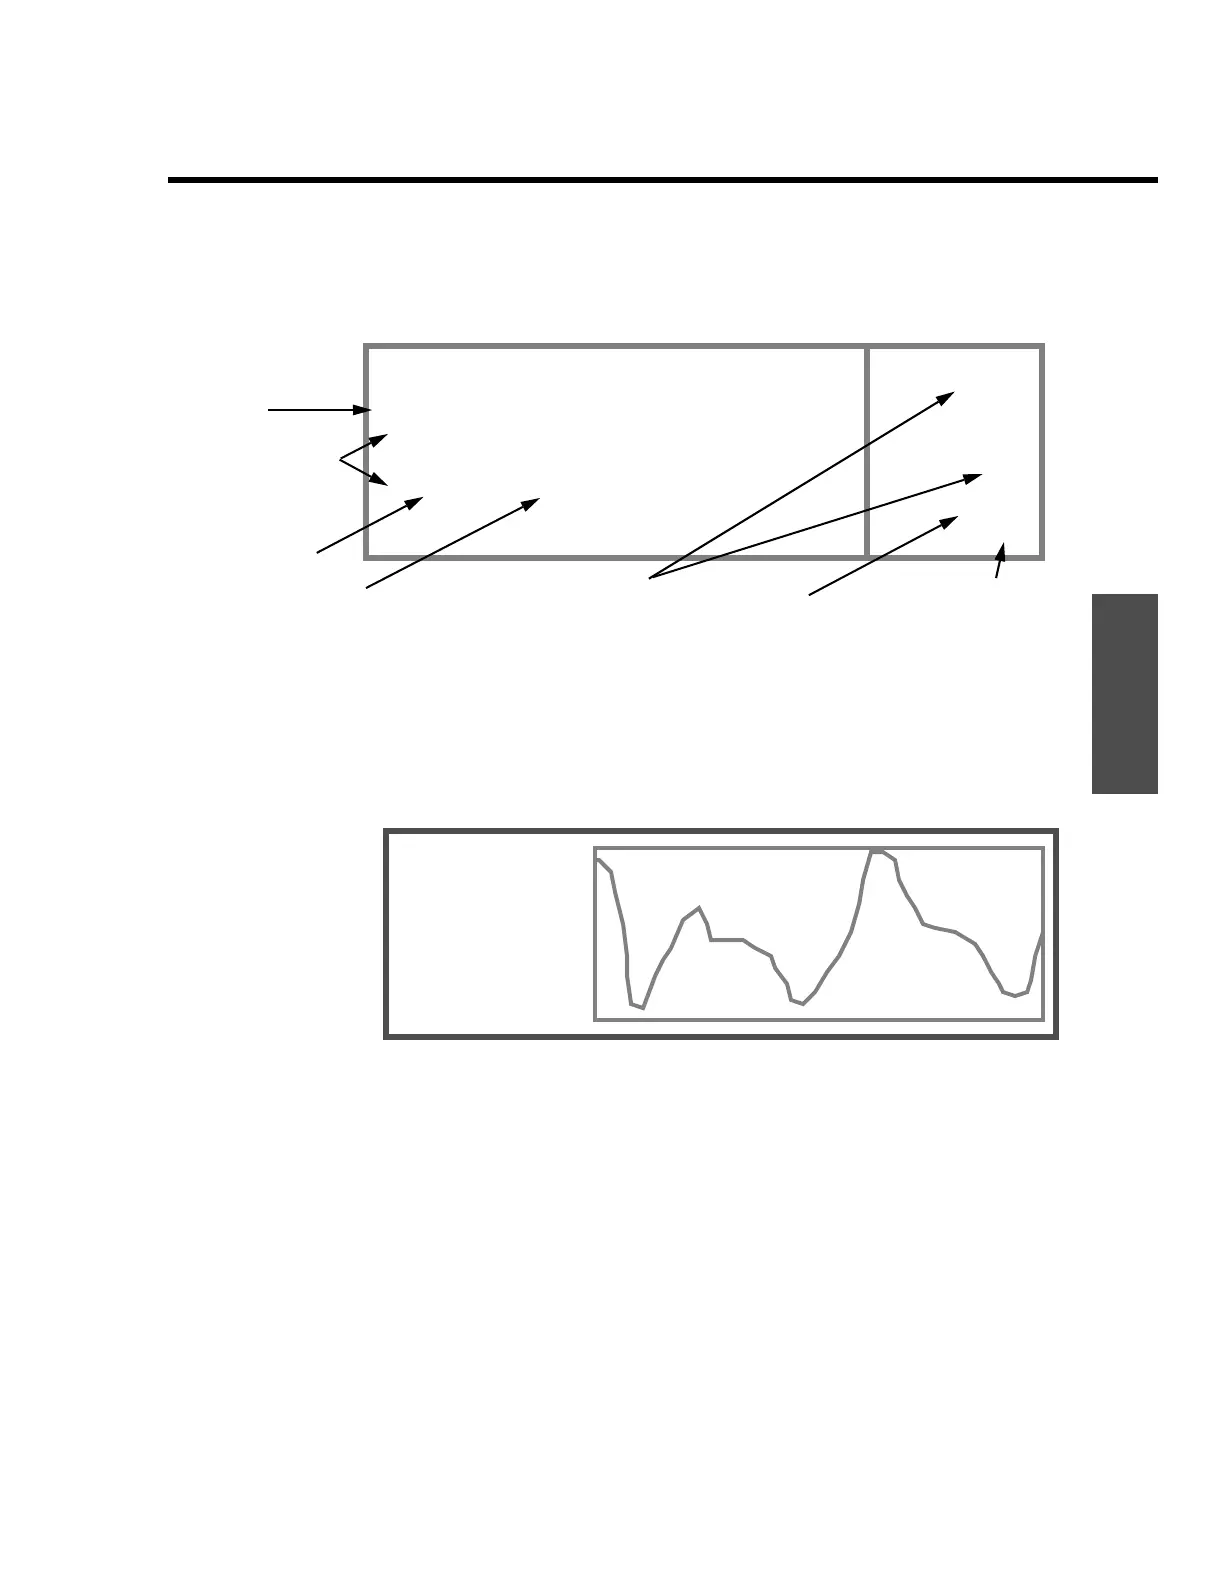
If you stop/pause your survey (at the end of a line, for example), you
caneither review the data quality or see a graphical display of the data.
1. You can push the “NUM/GRA” key to display a profile of up to the last 178
data points collected along the line (
LN). The display appears as follows:
-*MAG*-
TOTAL
mmmmm.m
LN:
llll.ld
ST:
ssss.sd
Figure A-17 Graphical display of a survey line.
2.
You can press the “NEXT” key to pop-up the graphical display of the
precession decay signal of the last reading. Very sharp, rapid decays
indicate possible poor signal conditions. The display appears as follows:
00 -* MAG *- 13:45:30
TOTAL NOISE GRADIENT LN: 50 E
59875.2 1.5 110.2 ST: 98 N
59623.7 0.9 62.9 97 N
59590.3 0.8 15.1 96 N
59581.4 1.9 2.3 95 N
MEMF: 88%
BATT: 134
Reading
Previous readings
Survey parameters
Free memory
Battery strength
Magnetic value
Noise
4
t
 Loading...