3.
Touch an injection group.
4.
View the results in the Run Result Details screen, or touch for well details.
See “Fragment/HID analysis results“ on page 113 or “Sequence analysis
results“ on page 115 for detailed information.
5.
Touch a sample le name.
If the data triggered any quality alerts, a QC alerts screen is displayed. See “Data
quality alerts“ on page 119 and “Sizecalling and basecalling quality alerts“ on
page 119 for detailed information.
Touch View data to display the analyzed trace for the sample. See
“Fragment/HID analysis trace“ on page 113 or “Sequence analysis trace“ on
page 115 for detailed information.
6.
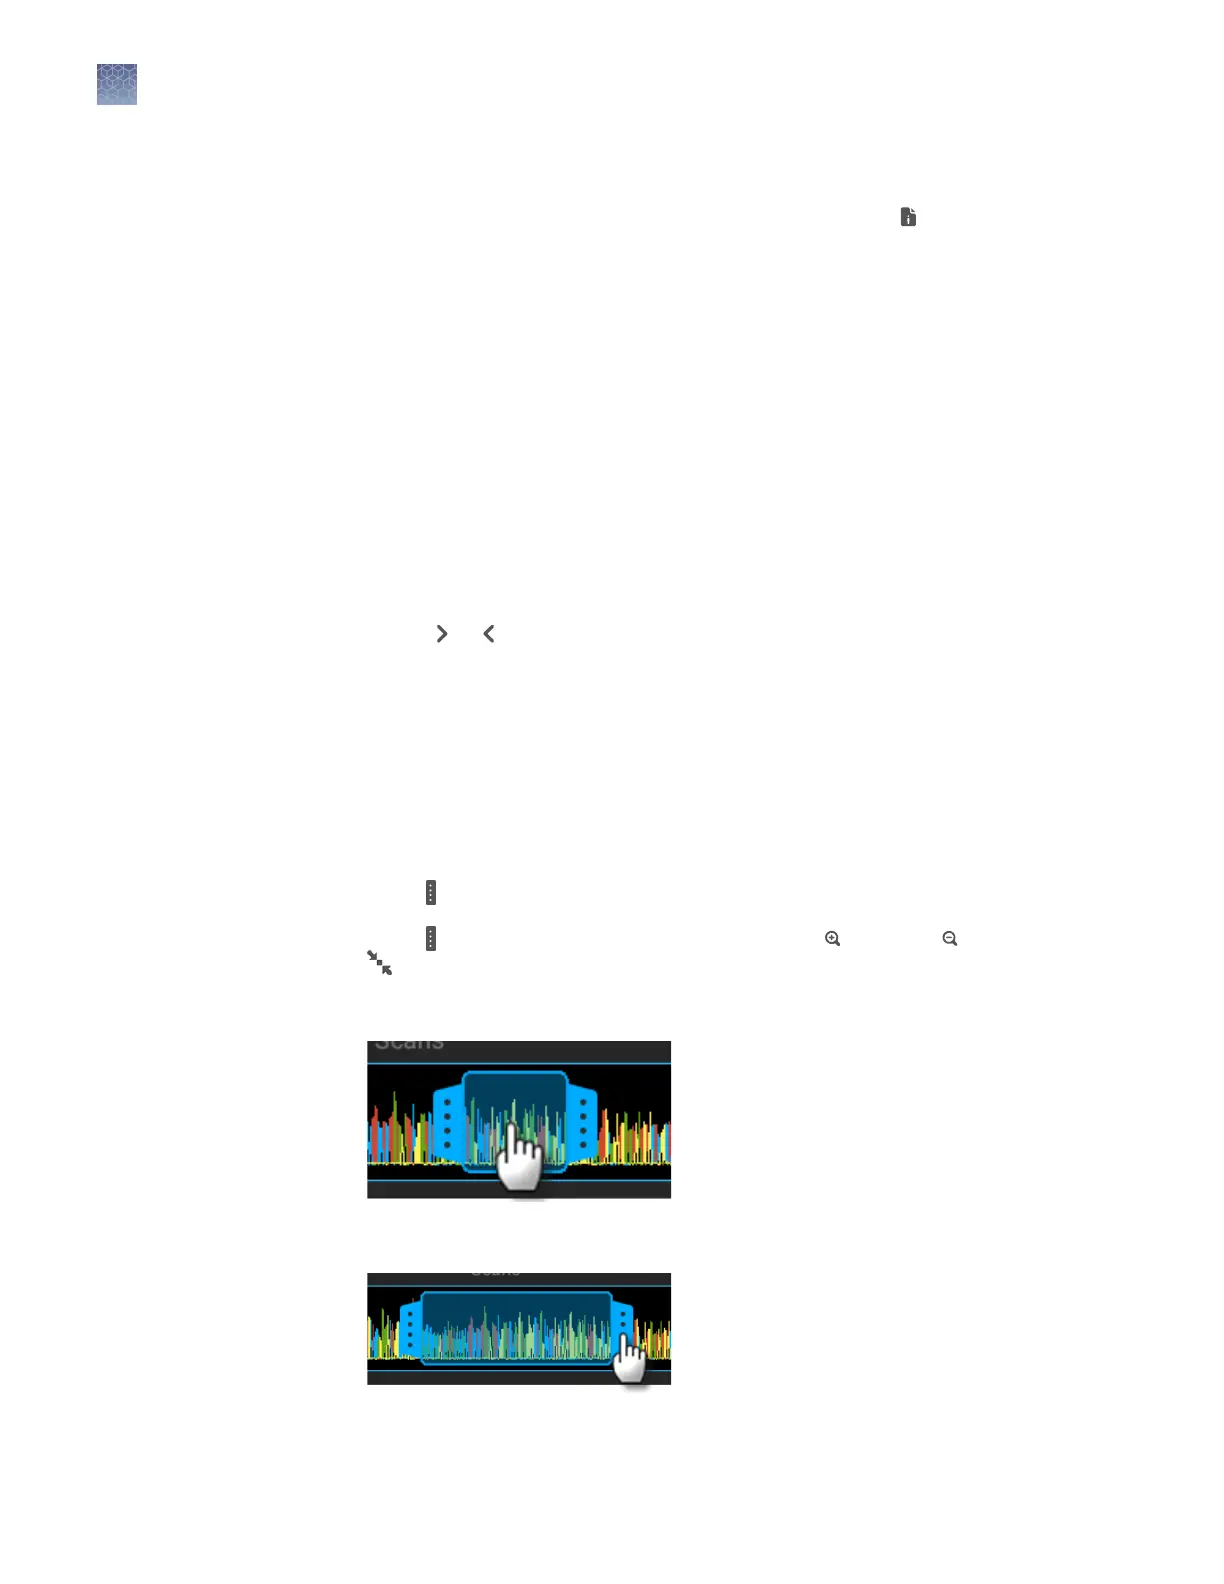
Touch and drag the thumbnail view of the analyzed trace (below the trace) to
scroll left or right.
7.
(Optional) Adjust the graphical view (see “Adjust the trace display“ on page 108).
8.
Touch
or to scroll to the raw data or EPT Plot (ElectroPhoresis Telemetry).
See “EPT plot“ on page 117.
Adjust the trace display
See “View results when the run is completed“ on page 107 to access results.
• Drag one nger to pan to the left or right.
• Zoom in and out by pinching and expanding with two ngers.
• Touch on the left border of the trace, then touch a dye to deselect.
• Touch
on the right border of the trace, then touch Zoom In, Zoom Out, or
Fit to screen to adjust the display.
• Drag the center of the pane in thumbnail view to scroll left or right.
• Drag the right or left handle of the pane to zoom horizontally.
Chapter 7 Start and monitor a run
Monitor a run from the instrument
7
108
SeqStudio
™
Genetic Analyzer Instrument and Software User Guide