Example 9: Displaying GSM-TDMA Bursts Measurement Examples
7-24 PN: 10585-00001 Rev. P ML2437A/38A OM/PM
In this example, the power meter is triggered from a TTL pulse which must be
connected to rear panel connector marked INPUT 1 DIGITAL. This pulse is generated
by the base station, or signal source, at the start of each 8-burst frame.
To set the trigger for a TTL pulse, press [Trigger]
> [Setup] > [SOURCE] and toggle this
setting until "EXTTTL" is displayed. To display the Measurement screen, press any
hard key.
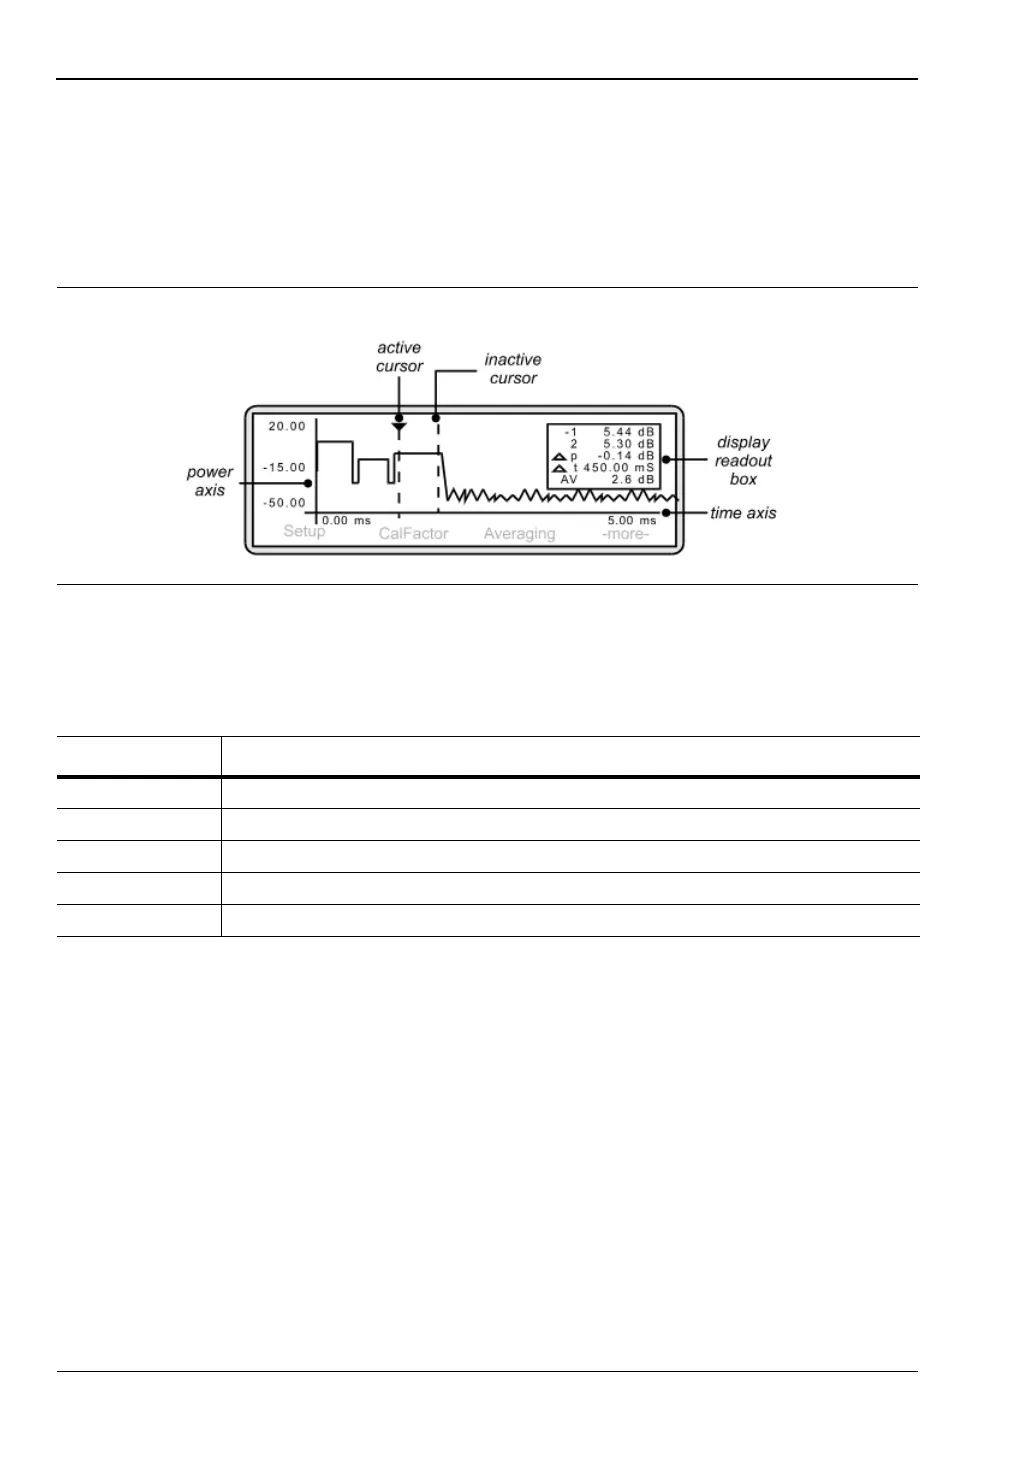
The frame is displayed on the screen and the display readout box on the right-hand side
shows:
3. Changing the axis scaling
In order to display the waveform clearly, it may be necessary to amend the X and Y axis
settings. To change the time axis, press [System]
> [Profile] > [Period].
The entered value of Data Collection Period determines the time axis scaling. Using the
keypad, input a period value that will result in the display of the required number of
time slots. Press either [ms.Enter] or [us.Enter]. In this example, a period of 5 ms will
result in the display of one frame (equals eight time slots).
To change the power axis, press [System]
> [Control] > [-more-] > [SCALE].
Press [TOP] and/or [BOTTOM] to set the dB values as required. Press [Enter] to accept
the values.
Alternatively, rather than entering top and bottom values, you can select [AUTO
SCALE].
Figure 7-37.
Table 7-4. Display Meanings
Item Meaning
1 the power measurement at cursor 1
2 the power measurement at cursor 2
p the power difference between cursors 1 and 2
t the time difference between cursors 1 and 2
AV the average power between cursors 1 and 2