Measurement Examples Example 8: Profiling Pulse Signals
ML2437A/38A OM/PM PN: 10585-00001 Rev. P 7-19
7-8 Example 8: Profiling Pulse Signals
The ML2430A Series Power Meter can be used to view signals graphically as well as digitally.
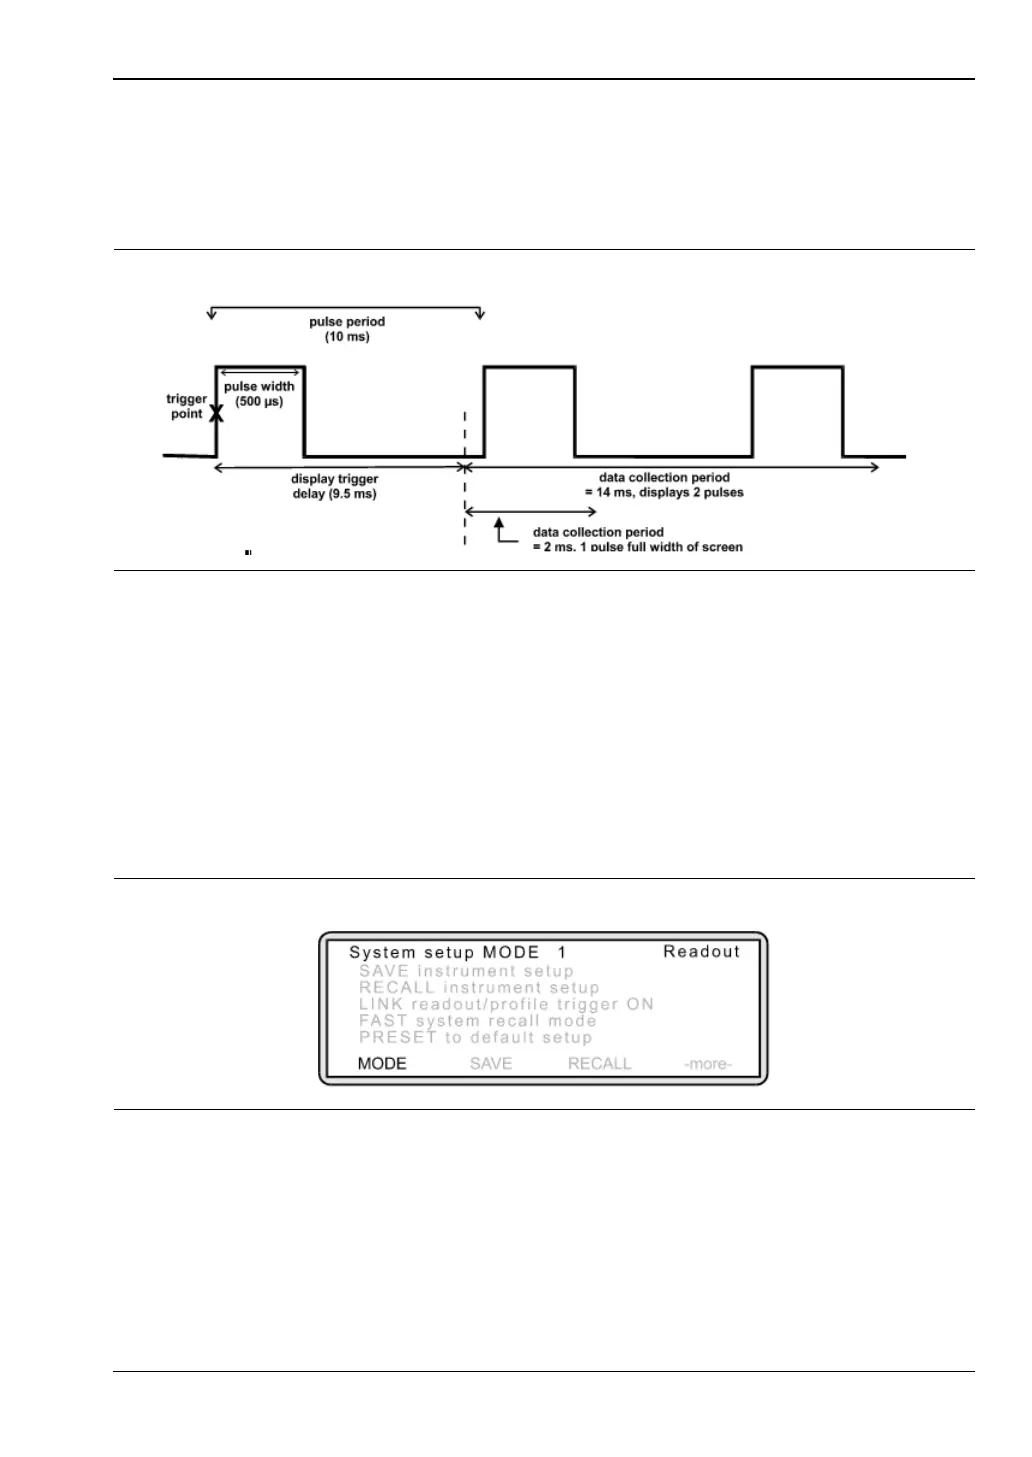
In this example, we will measure a pulse with a duration of 500 ms and a pulse period of
10 ms.
Display trigger delay is a time delay from the trigger point to the time when the power meter
starts to collect data. It can be used to view the complete rising edge of a pulse which would
otherwise be on the extreme left of the instrument display.
Data collection period is the length of time for which data is captured. It also defines the time
axis settings.
1. Changing from Readout to Profile mode
Press [System]
> [Setup].
The following screen is displayed:
Figure 7-29.
Figure 7-30.