DRAFT
September 1, 2004 11:39 am, CH_Real-Time.fm
Chapter 6 Analyzing Real-Time Data
6-6 Applied Biosystems 7900HT Fast Real-Time PCR System and SDS Enterprise Database User Guide
Overview
About Absolute
Quantification
The Applied Biosystems 7900HT Fast Real-Time PCR System supports real-time
absolute quantification of nucleic acids using a standard curve method. The objective
of absolute quantification is to accurately determine the absolute quantity of a single
nucleic acid target sequence within an unknown sample. The results of an absolute
quantification experiment are reported in the same unit of measure as the standard
used to make them.
Employing the
5´ Nuclease
Assay
Absolute quantification on the 7900HT instrument is accomplished through the use
of the polymerase chain reaction and the fluorogenic 5´ nuclease assay (see
page D-2). During setup, standards diluted over several orders of magnitude and
unknown samples are loaded onto an optical plate containing master mix and
TaqMan reagents targeting a specific nucleic acid sequence. The plate is then loaded
into a 7900HT instrument which has been configured to perform a real-time run.
During the thermal cycling, the instrument records the emission resulting from the
cleavage of TaqMan
®
probes in the presence of the target sequence. After the run, the
SDS software processes the raw fluorescence data to produce threshold cycle (C
T
)
values for each sample (see page D-6). The software then computes a standard curve
from the C
T
values of the diluted standards and extrapolates absolute quantities for
the unknown samples based on their C
T
values (see below).
Note: See Appendix D, “Theory of Operation,” for more information on the
fluorogenic 5´ nuclease assay, real-time data collection, or the mathematical
transformations of sequence detection data.
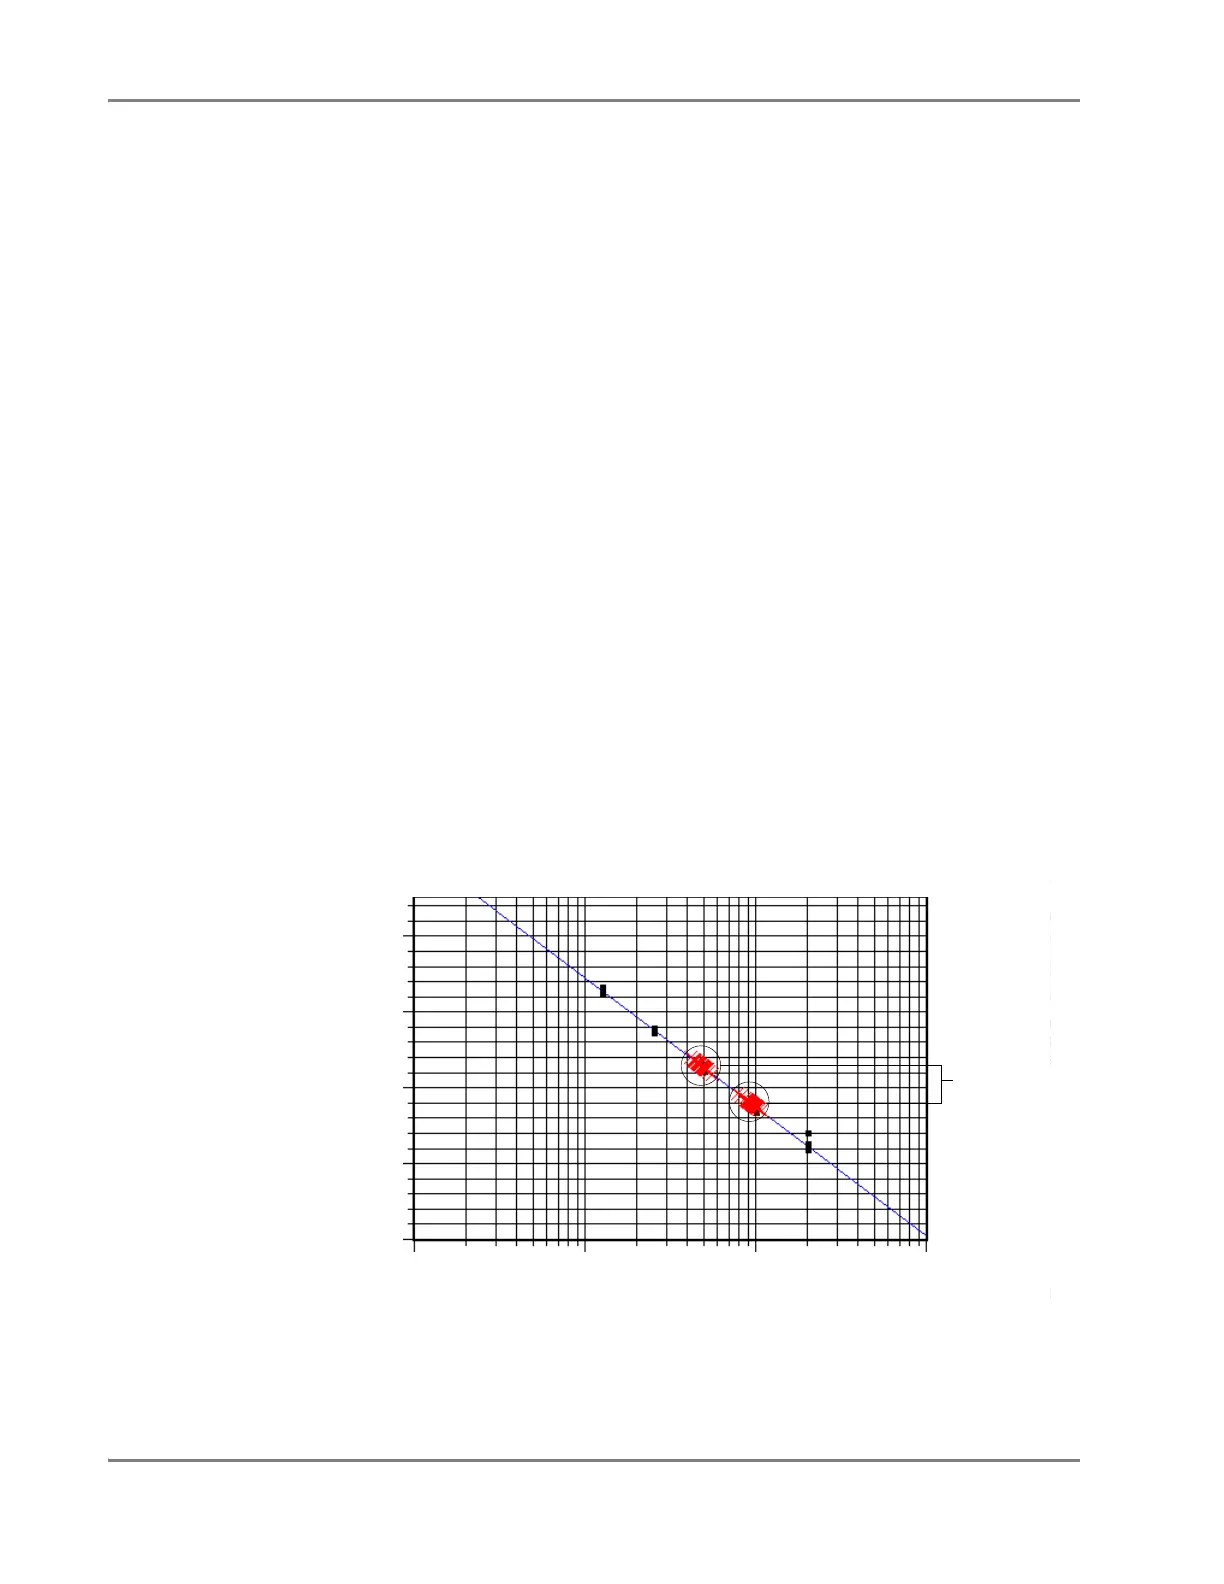
Figure 6-3 illustrates a standard curve generated from a standard TaqMan
®
RNase P
Instrument Verification Plate. The arrangement of the samples and standards on the
plate are shown in “Examples in This Chapter” on page 6-8.
Figure 6-3 Standard Curve Generated from a TaqMan RNase P Instrument
Verification Plate
Quantity
(LogN initial concentration)
C
T
Unknowns
20
22
24
26
28
1.0 E+2 1.0 E+3 1.0 E+4 1.0 E+5
Standard Curve Plot