DRAFT
September 1, 2004 11:39 am, CH_Real-Time.fm
Chapter 6 Analyzing Real-Time Data
6-22 Applied Biosystems 7900HT Fast Real-Time PCR System and SDS Enterprise Database User Guide
Analysis Checklist
Workflow
Overview
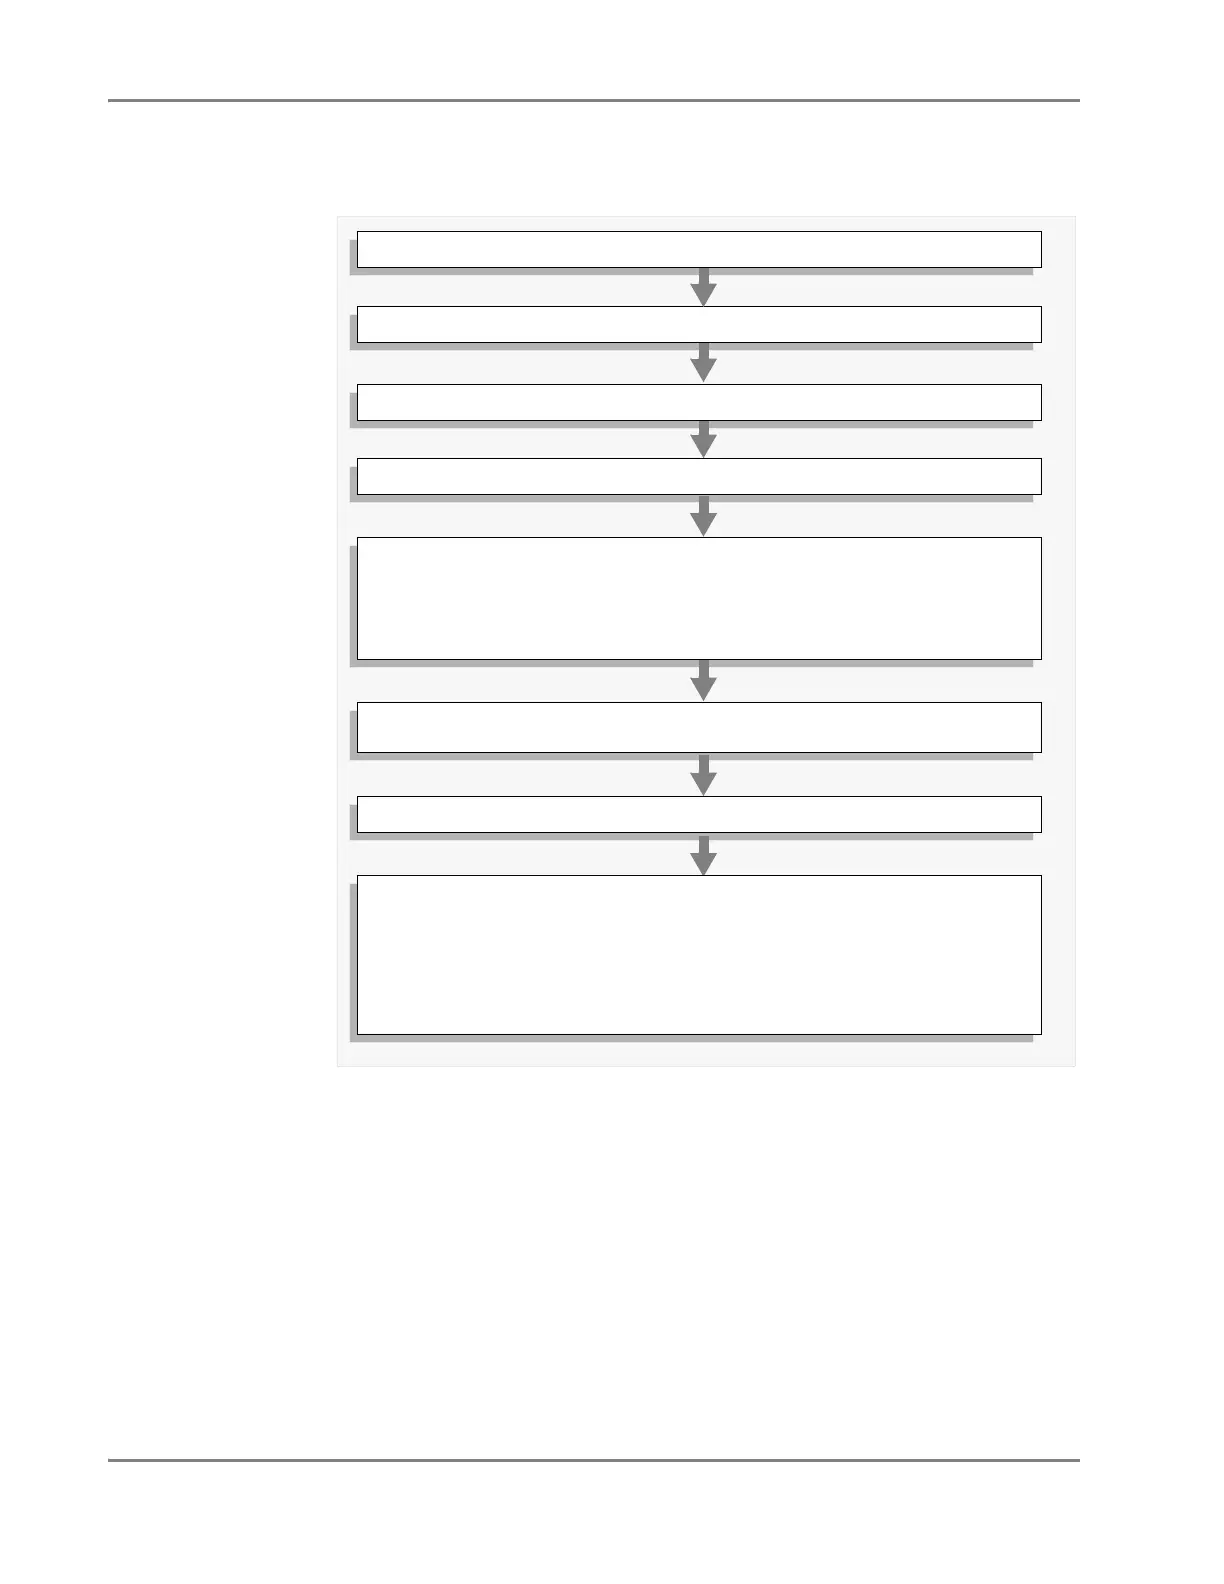
1. Create an SDS 7900HT Multiple Plate Document (see page 6-23).
2. Add relative quantification plates for the analysis (see page 6-24).
3. Configure the analysis settings for the run (see page 6-26).
4. Analyze the run data (see page 6-30).
5. For each detector that you configured to determine the baseline and threshold
values (see page 6-46):
– Automatically – Verify that the baseline and threshold values for the detector
were set correctly by the software.
– Manually – Set the baseline and threshold values for the detector.
6. For each detector that you configured for manual outlier removal, visualize outliers
and eliminate any outlying amplification from the run data (see page 6-49).
7. View the results of the relative quantification run (see page 6-31).
8. Choose from the following post-analysis settings (see page 6-35):
– Reanalyze the run data.
– Adjust the display settings for the results table, plate grid, and plate
document plots.
– Print elements of the plate document.
– Export the plate document results table or plots.