DRAFT
September 1, 2004 11:39 am, CH_Real-Time.fm
Chapter 6 Analyzing Real-Time Data
6-46 Applied Biosystems 7900HT Fast Real-Time PCR System and SDS Enterprise Database User Guide
Setting the Baseline and Threshold Values
Setting the
Baseline and
Threshold Values
for the Run
If you choose to set the baseline and threshold values manually for any detector in the
study, you need to perform the following procedure for each detector.
1. Select the Results tab.
2. If setting the baseline and threshold for a:
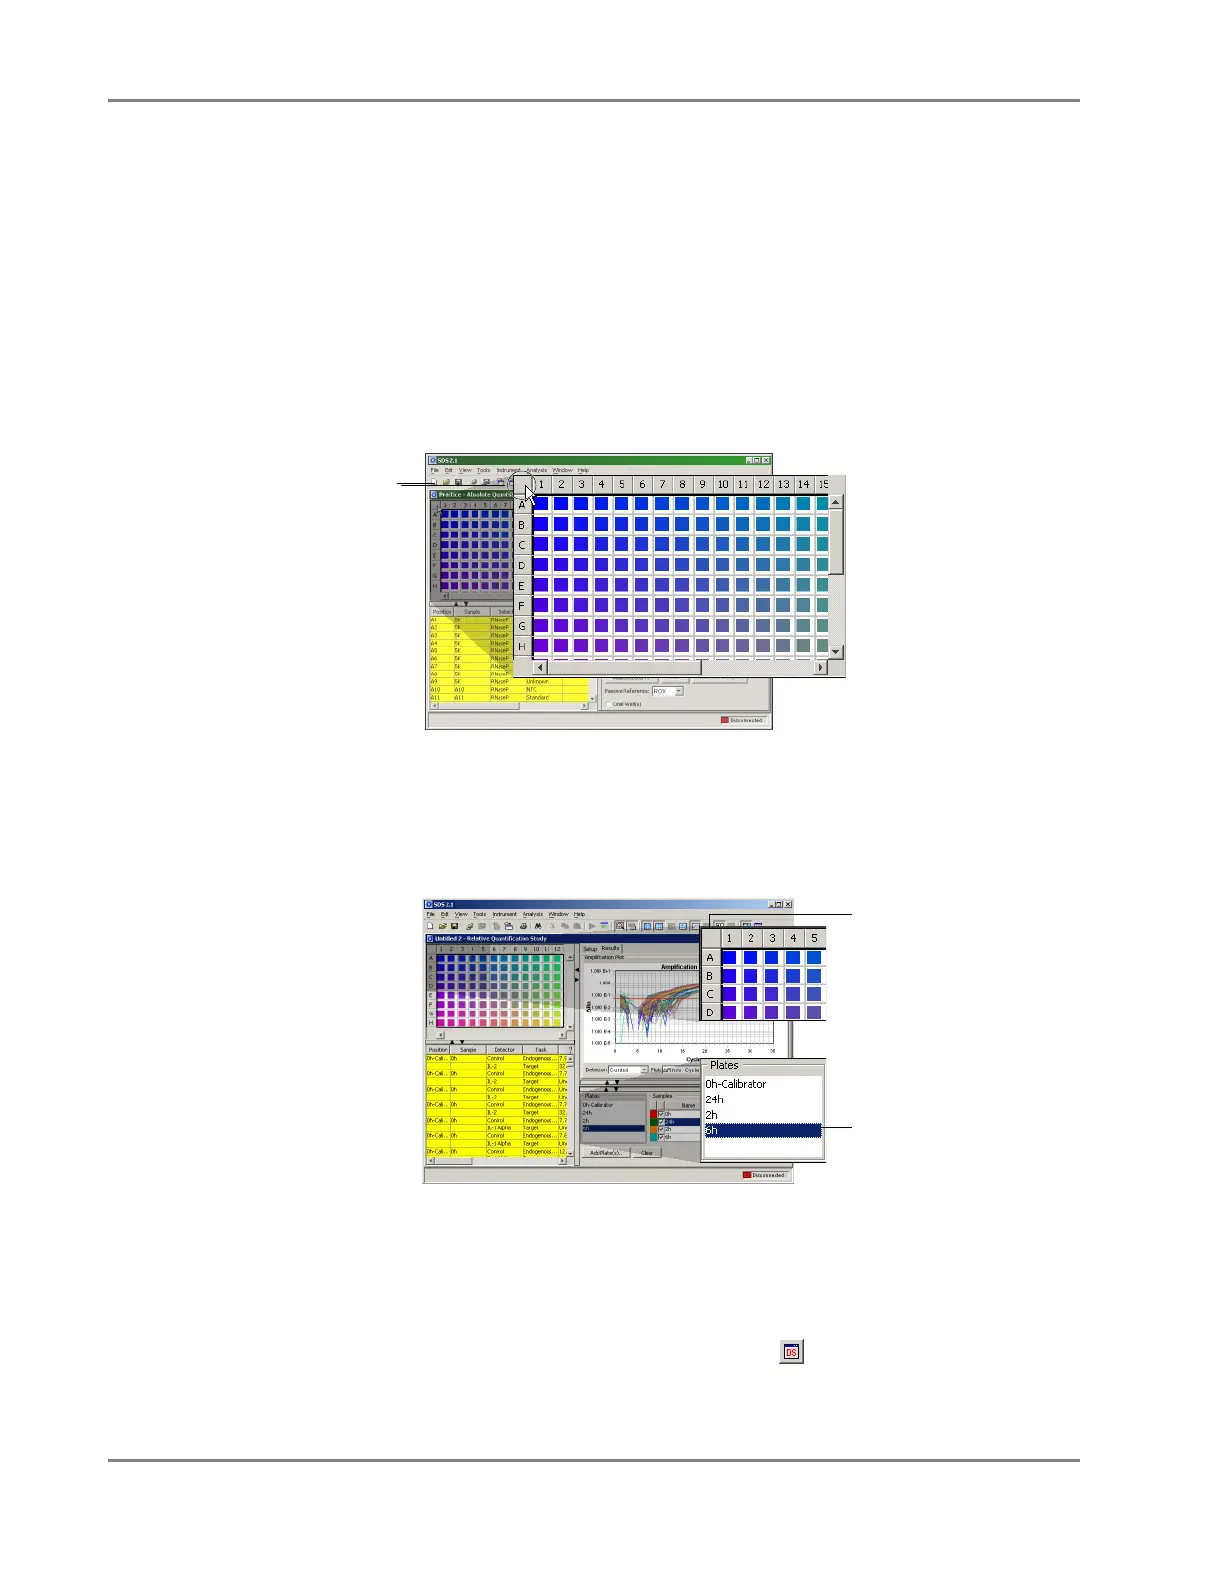
Absolute Quantification Plate Document
Select all wells of the plate by clicking the upper-left corner of the plate
grid.
Relative Quantification Multiple Plate Document
a. Select a plate in the Plates field to view, then select all wells of the plate by
clicking the upper-left corner of the plate grid.
b. Repeat step a to select all wells of every plate in the study.
3. In the Detector drop-down list in the
Amplification plot
, select a detector for
which you want to set the baseline and threshold values.
The software displays the data for the selected wells within the Amplification plot.
4. In the Plot drop-down list, select ∆R
n
vs. Cycle.
5. Double-click the Amplification plot, or click .
Button
Select a plate here
Click here to select all
wells of the plate grid