DRAFT
September 1, 2004 11:39 am, CH_Real-Time.fm
Setting the Baseline and Threshold Values
Applied Biosystems 7900HT Fast Real-Time PCR System and SDS Enterprise Database User Guide 6-47
6. In the Display Settings dialog box:
a. In the Select Pane/View field, select Amplification Plot.
b. In the Y Axis group box of the Scale tab, select the Linear option button.
c. Click .
7. Identify the components of the linear scale Amplification plot and set the
baseline so that the amplification curve growth begins at a cycle number greater
than the Stop baseline cycle.
If you are inspecting an AutoCalled detector, verify that the baseline is called
correctly by the software and proceed to step 8. If the baseline is set incorrectly,
open the Analysis Settings dialog box, configure the detector for manual
calling, then click . After the software adjusts the data, manually set the
baseline and threshold for the detector as described in this procedure.
8. Double-click the Amplification plot or click .
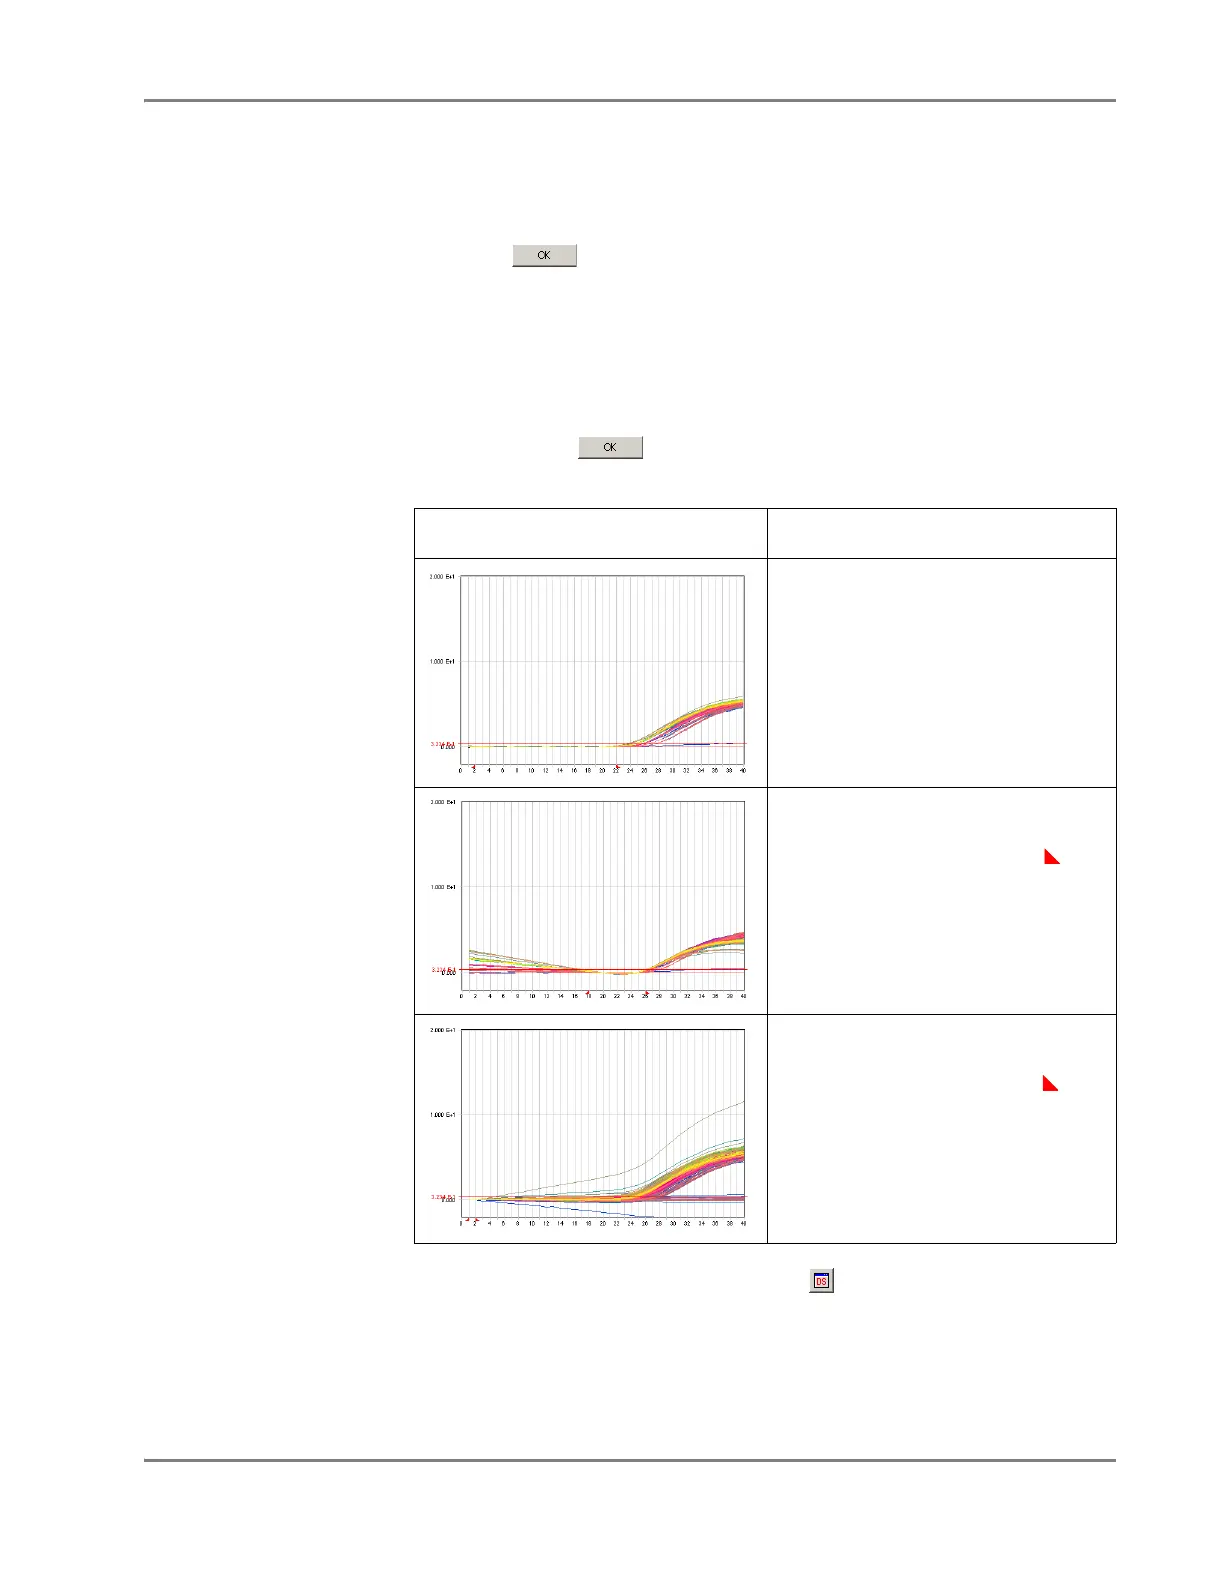
If the amplification plot looks like... Then...
The amplification curve begins after the
default maximum baseline (cycle 15).
Adjustment of the baseline is not
required.
The maximum baseline is set too high.
Decrease the Stop baseline value by
dragging the right range marker ( ) to
an earlier cycle.
The maximum baseline is set too low.
Increase the Stop baseline value by
dragging the right range marker ( ) to a
later cycle.