DRAFT
September 1, 2004 11:39 am, CH_Real-Time.fm
Chapter 6 Analyzing Real-Time Data
6-48 Applied Biosystems 7900HT Fast Real-Time PCR System and SDS Enterprise Database User Guide
9. In the Display Settings dialog box:
a. In the Select Pane/View field, select Amplification Plot.
b. In the Y Axis group box of the Scale tab, select the Log option button.
c. Click .
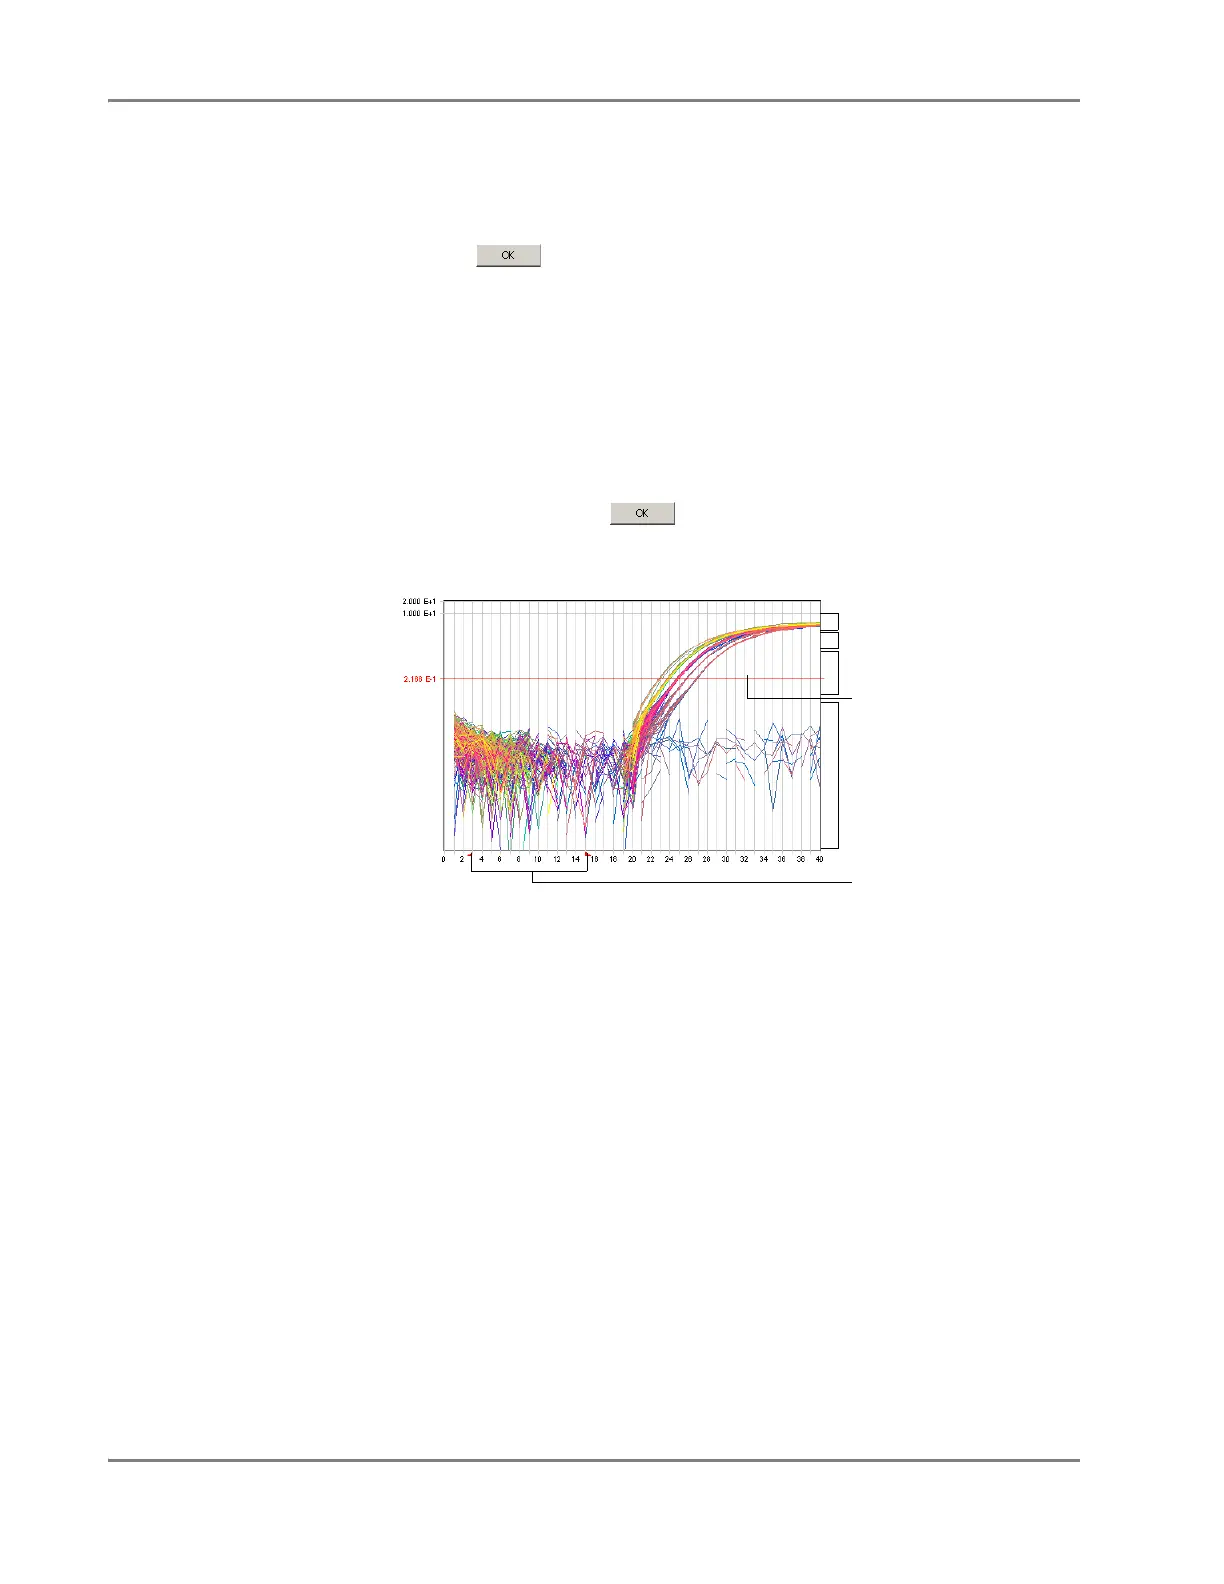
10. Identify the components of the amplification curve and set the threshold so that
it is:
• Above the background
• Below the plateaued and linear regions of the amplification curve
• Within the geometric phase of the amplification curve
If you are inspecting an AutoCalled detector, verify that the threshold is called
correctly by the software and proceed to step 11. If the threshold is set
incorrectly, open the Analysis Settings dialog box, configure the detector for
manual calling, then click . After the software adjusts the data, manually
set the baseline and threshold for the detector as described in this procedure.
11. Repeat steps 3 through 10 to set the baseline and threshold values for all
remaining detectors present on the plate.
12. If you choose to eliminated outliers
• Automatically – View the results.
• Manually – Visualize and eliminate outliers from the analyzed run data as
explained in “Eliminating Outlying Amplification” on page 6-49.
Linear phase
Cycle
R
n
Geometric phase
Background
Threshold setting
(click and drag)
Baseline
Plateau phase