DRAFT
September 1, 2004 11:39 am, CH_Real-Time.fm
Before You Begin
Applied Biosystems 7900HT Fast Real-Time PCR System and SDS Enterprise Database User Guide 6-39
Example Results
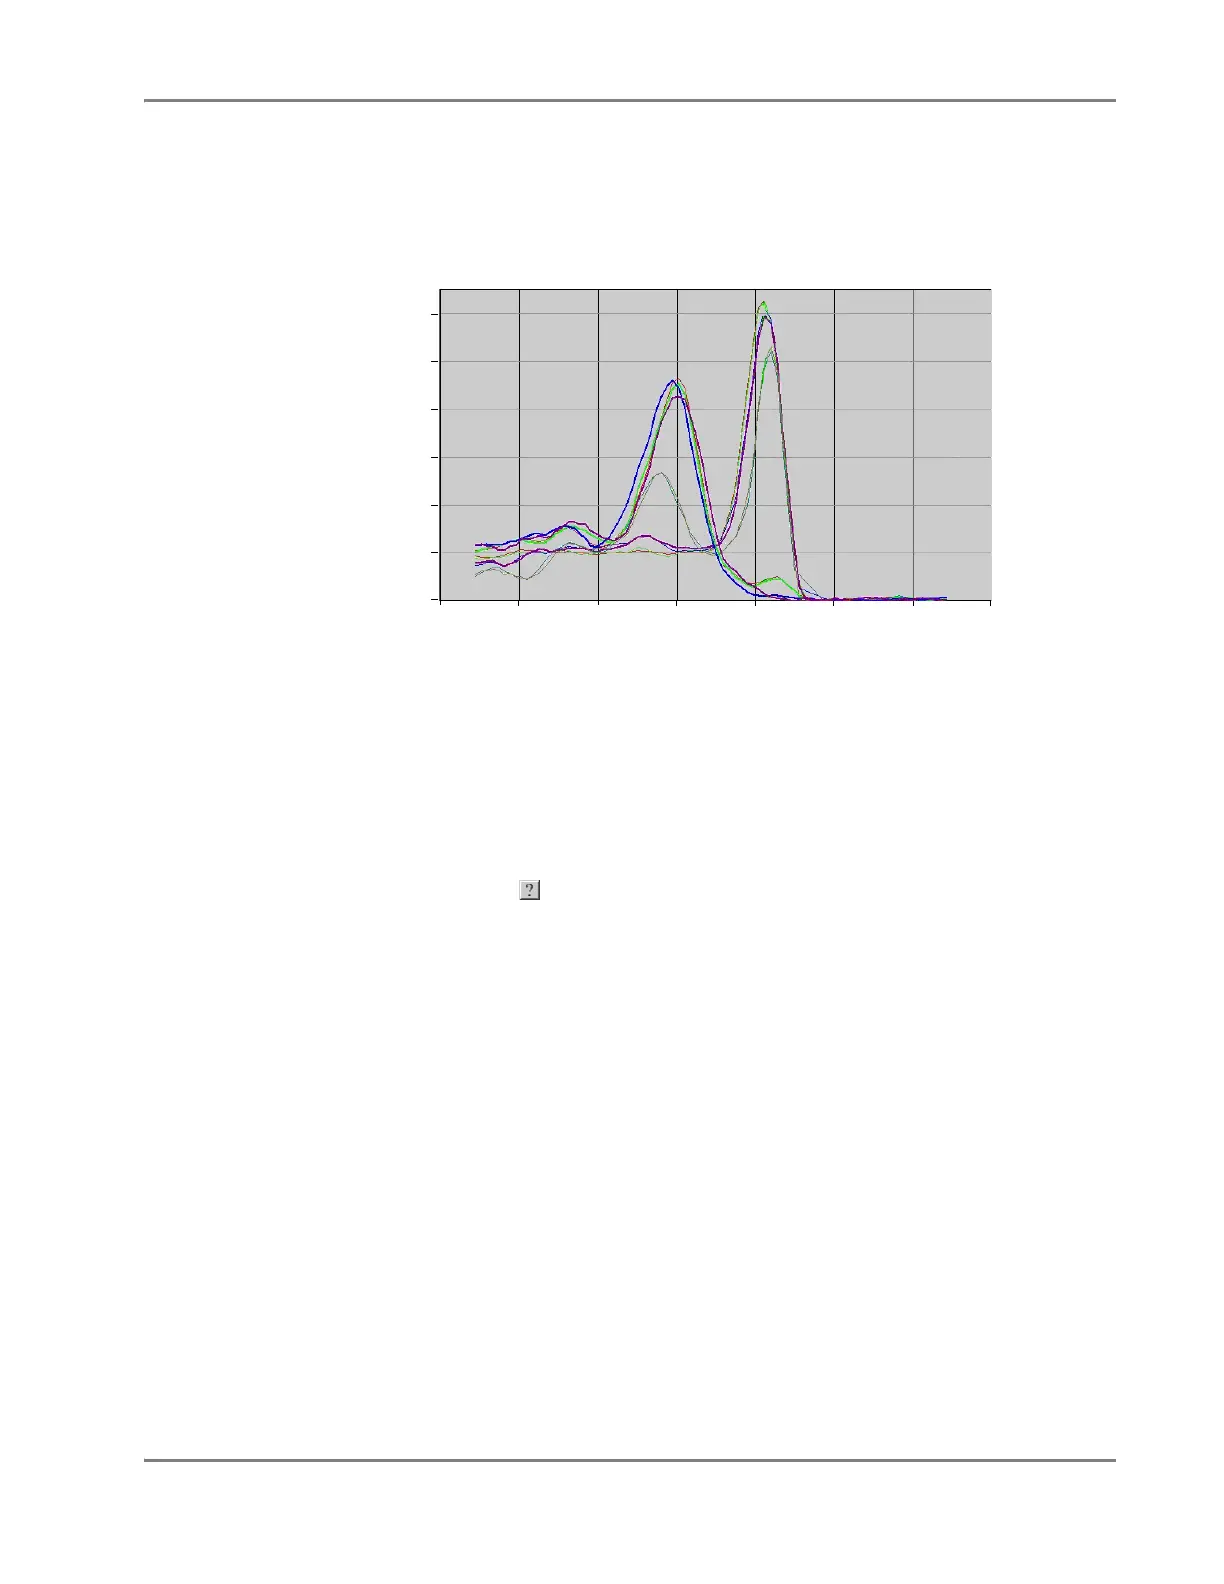
Figure 6-14 illustrates a typical dissociation curve from an experiment run to detect
non-specific amplification in cDNA samples. The figure displays the dual
amplification peaks typical of primer-dimer formation. The amplification from the
specific product is displayed with a T
m
of 80.5 °C, while the primer-dimer product
has a characteristically lower T
m
of 74.9 °C.
Figure 6-14 Example of Results from a Dissociation Curve Analysis
Before You Begin
Using the SDS
Software
Online Help
For specific instructions on any procedure described within this section, refer to the
Sequence Detection Systems Software Online Help. To get help at any time during the
procedure, click located within the dialog box or window in which you are
working.
Examples in This
Chapter
The illustrations and screenshots that appear within this chapter were created from a
plate run to determine the purity of a β-actin amplification in unknown samples.
Each well of the plate contains SYBR Green 1 dye, forward and reverse primers, and
genomic DNA known to contain complimentary binding sites.
60 65 70 75 80 85 90 95
0.0
-1.0
-2.0
-3.0
-4.0
-5.0
-6.0
Temperature (°C)
Primer
Dimer
Main Product
T
m
=80.5°C
-R
n