DRAFT
September 1, 2004 11:39 am, CH_End-Point.fm
Calling and Scrutinizing Allelic Discrimination Data
Applied Biosystems 7900HT Fast Real-Time PCR System and SDS Enterprise Database User Guide 5-13
Calling and Scrutinizing Allelic Discrimination Data
About the Allelic
Discrimination
View
The SDS software graphs the results of allelic discrimination runs on a scatterplot
contrasting reporter dye fluorescence. After signal normalization and
multicomponent analysis, the software graphs the normalized data from each well as
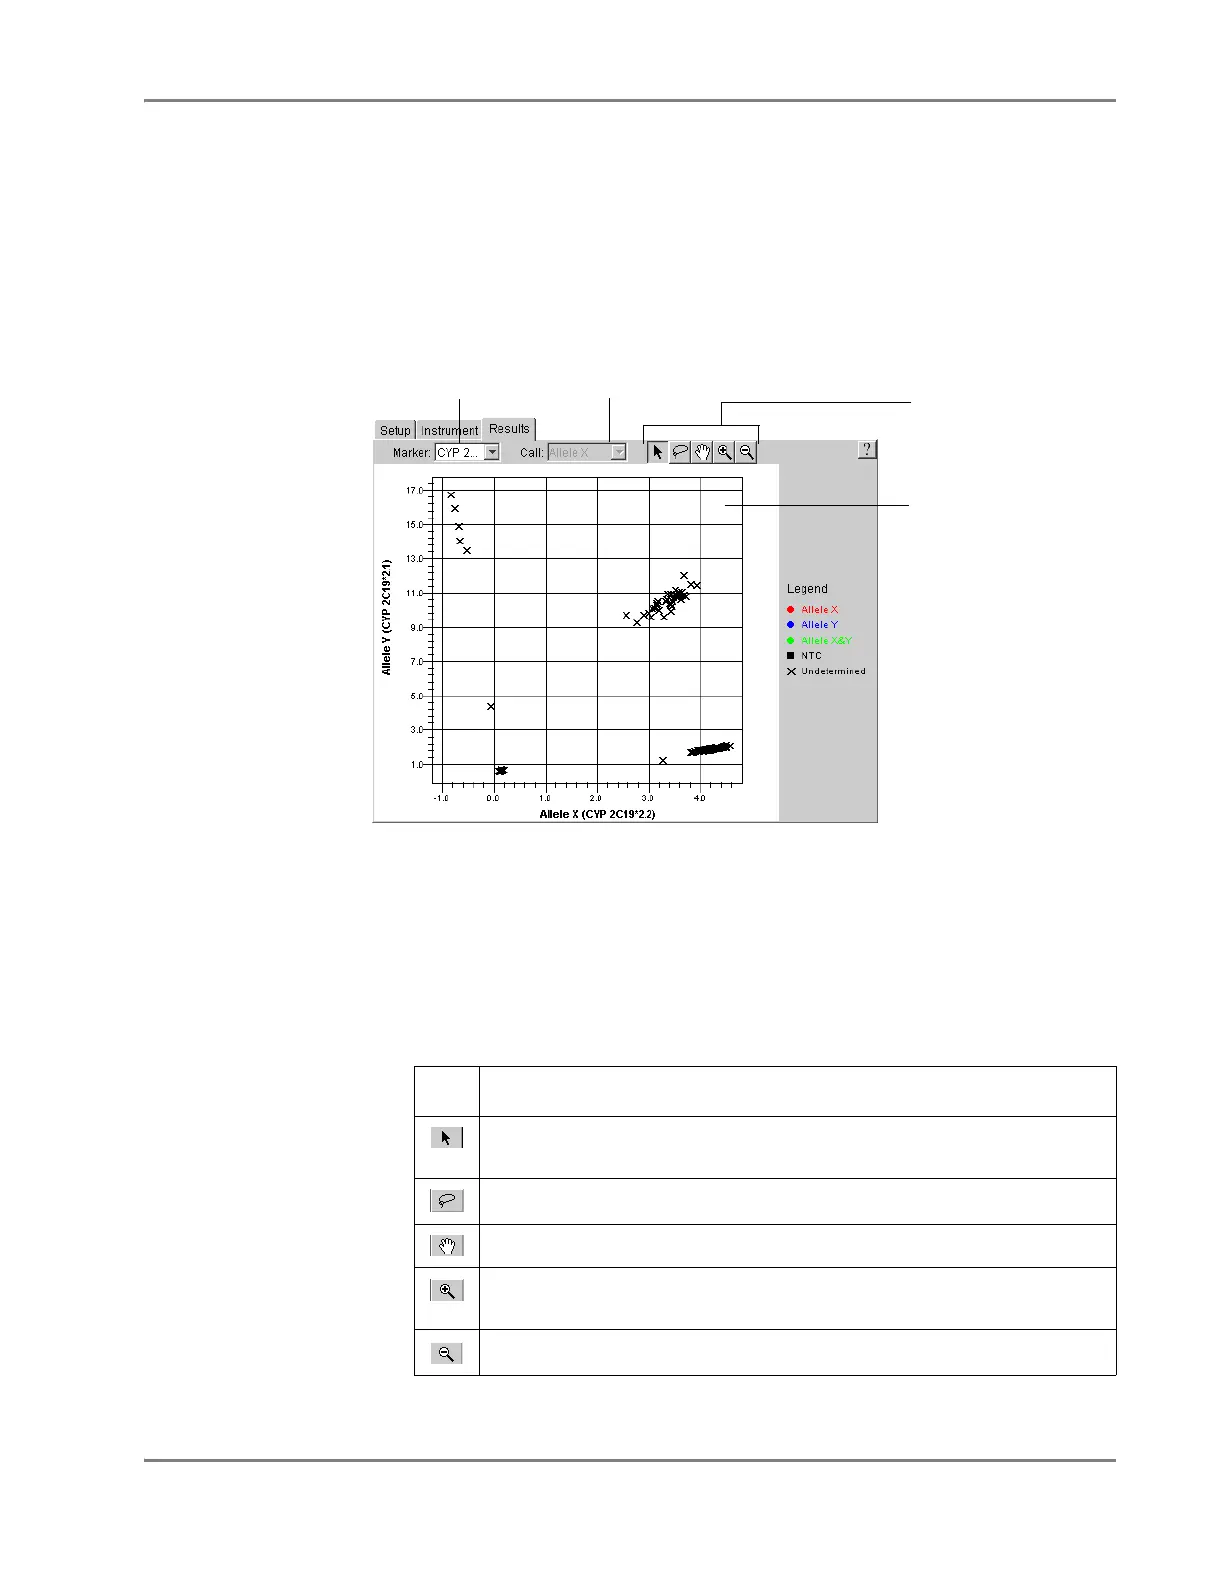
a single data point on the plot. Figure 5-6 illustrates the components of the Allelic
Discrimination plot.
Figure 5-6 Components of the Allelic Discrimination Plot
• Marker drop-down list – Determines the marker data that the software displays
within the plot.
• Call drop-down list – When a datapoint is selected, this menu allows you to
assign an allele call to the datapoint within the scatterplot.
• Toolbar – Contains the following tools for manipulating the plot.
• Scatterplot – A scatterplot of data points from the run.
Icon Description
Selects individual data points by clicking or groups of datapoints by clicking
and dragging a box across a group of data points.
Selects groups of datapoints by encircling them with the tool.
Repositions the view within the plot by clicking and dragging the screen.
Zooms the plot by clicking the mouse button within the plot or by clicking
and dragging a section of the plot to view.
Zooms out on the plot by clicking the mouse button within the plot.
Scatterplot
Toolbar
Marker
drop-down list
Call
drop-down list