DRAFT
September 1, 2004 11:39 am, CH_Real-Time.fm
Viewing Results
Applied Biosystems 7900HT Fast Real-Time PCR System and SDS Enterprise Database User Guide 6-31
Viewing Results
Displaying the
Analyzed Data
The Gene Expression plot displays the data of the selected target detector(s) in the
Detectors list. The SDS software allows you to limit the detector and plate data
displayed in the Gene Expression plot through the Plates and Targets tables of the
Plate List Panel. The software displays data from the targets and plates in the lists
whose check boxes are selected.
About the Gene
Expression Plot
The SDS software displays the graphic equivalent of the results of the relative
quantification (∆∆C
T
) calculations in the Gene Expression plot. The plot is in the
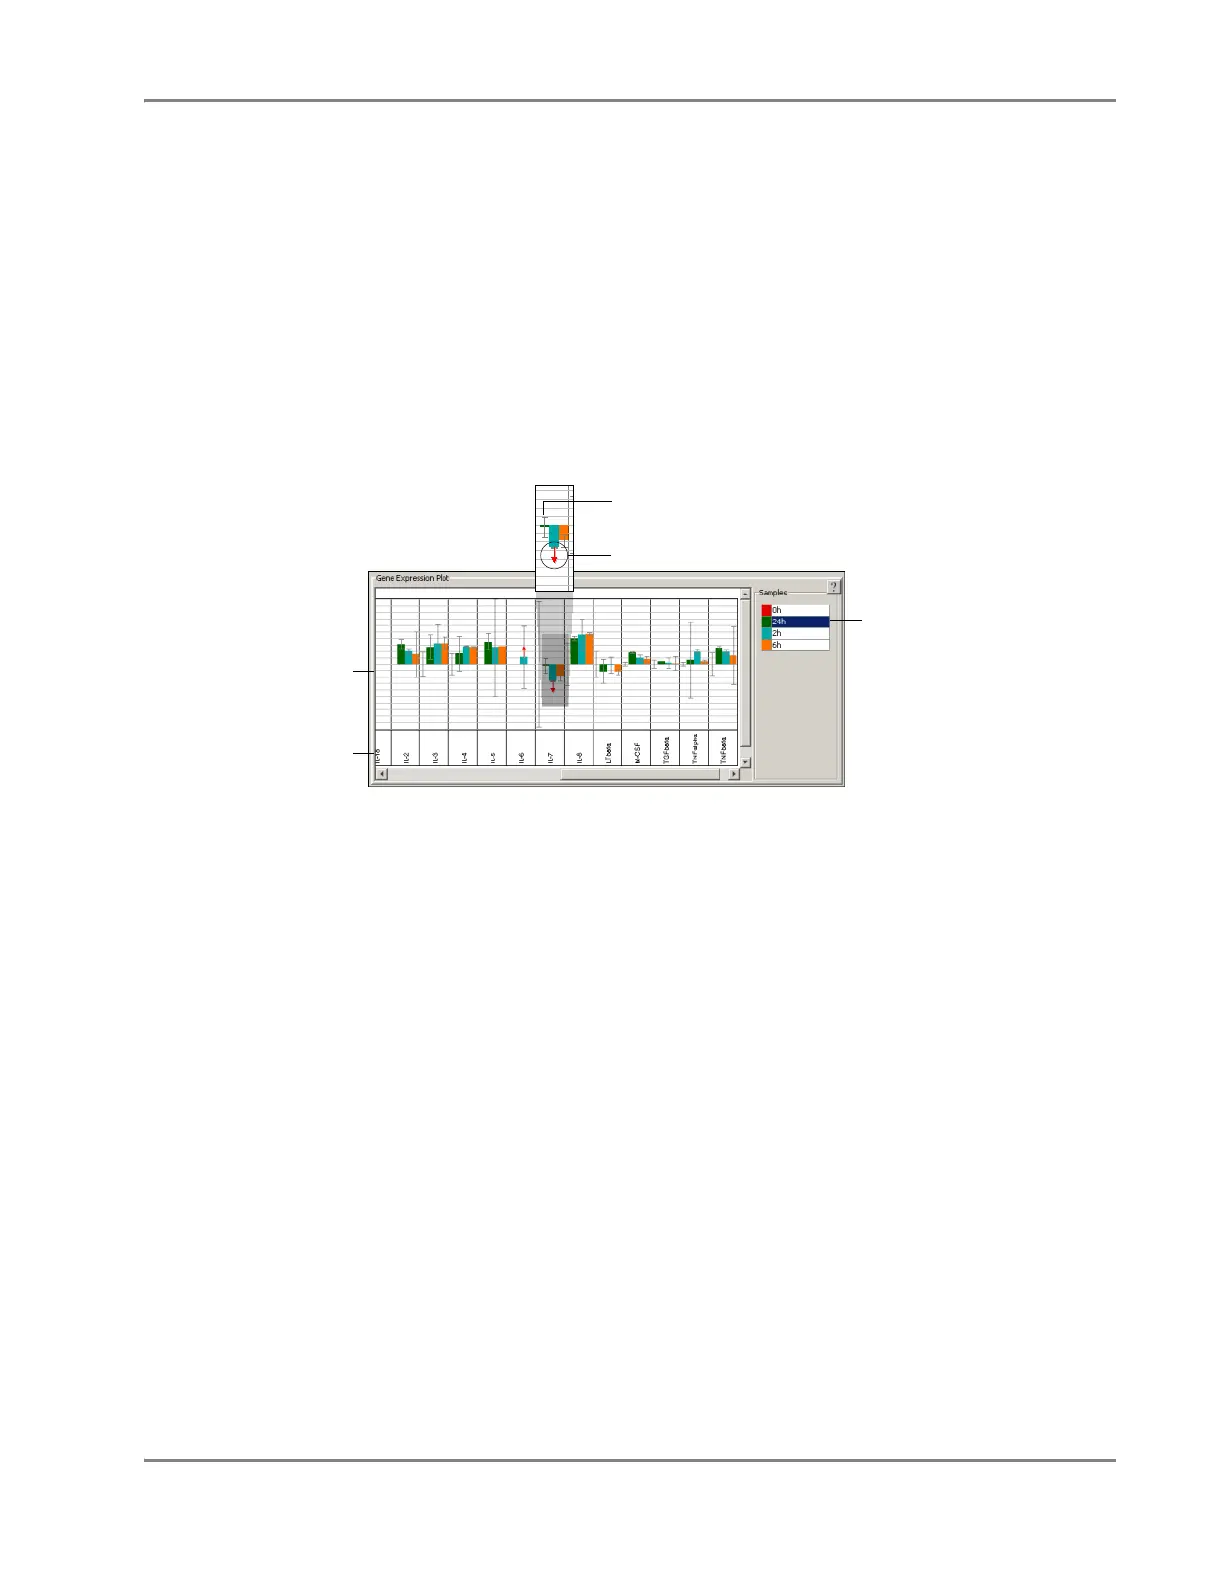
upper division of the multiple plate document. Figure 6-12 illustrates the important
components of the plot.
Figure 6-12 Components of the Gene Expression Plot
• X–Axis – Lists all the targets involved in the analysis. Within each target group,
the software displays the relative quantity of the target in each sample.
• Y–Axis – The results of the relative quantification calculations are grouped by
target sequence, and the relative quantities are graphed on a logarithmic scale.
The quantities are shown relative to the expression level in the calibrator sample,
where each increment corresponds to a 10-fold difference in gene expression.
About the
Expression
Levels
The SDS software displays the results of the relative quantification calculations on a
logarithmic scale where each increment corresponds to a 10-fold difference in gene
expression. The software displays the expression level for each selected detector
relative to the expression level in the calibrator sample (shown in the Calibrator
drop-down list).
Note:
Because the calibrator is compared to itself, the expression level for the calibrator
always appears as 1 (1E+00).
Table 6-1 on page 6-32 summarizes the circumstances in which the SDS software
displays gene expression levels for sample replicate groups. The shaded rows of the
table indicate the combinations of data for which the software cannot calculate
accurate expression levels.
Note: The expression minimum ( ↑) and maximum ( ↓ ) symbols are described in
detail on the page 6-33.
Legend
Arrow (see page 6-31)
Error bar (see below)
Plot
Detectors