DRAFT
September 1, 2004 11:39 am, CH_Real-Time.fm
Viewing Results
Applied Biosystems 7900HT Fast Real-Time PCR System and SDS Enterprise Database User Guide 6-33
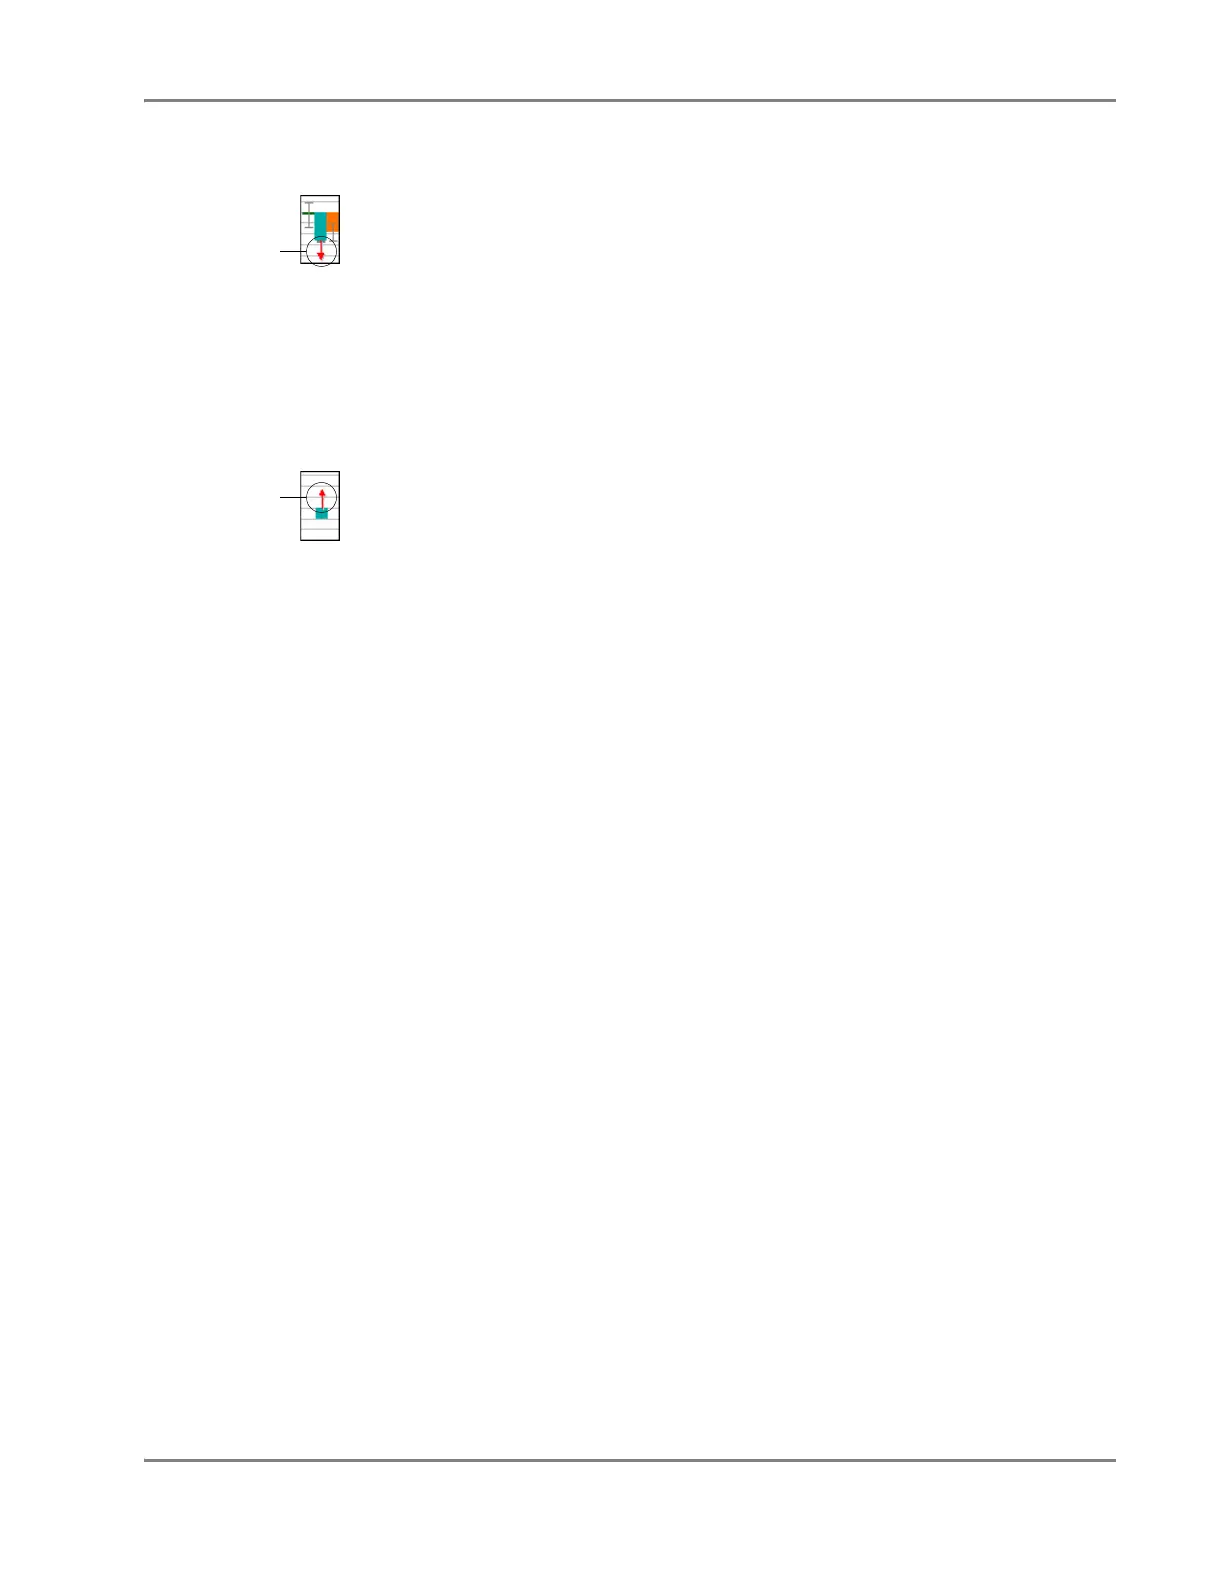
About Down
Arrows
The software displays a down arrow to indicate that a level of expression represents
the maximum target gene expression level. The software displays the down arrow on
a sample bar when:
• The calibrator sample for the detector group yields valid target and endogenous
control C
T
s (C
T
s less than the maximum cycle), and
• A test sample yields an undetermined target C
T
(and a valid endogenous
control).
At the levels above, the test sample does not contain enough target cDNA for an
accurate comparison (with the calibrator sample). Therefore, the stated expression
level is the maximum possible value for the associated test sample.
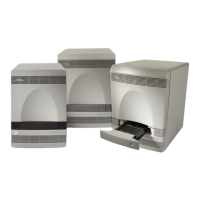
About Up Arrows
The software displays an up arrow to indicate that a level of expression represents the
minimum target gene expression level. The software displays the up arrow on all
associated sample bars when:
• The target sample for the detector group yields valid target and endogenous
control C
T
s (C
T
s less than the maximum cycle), and
• A calibrator sample yields an undetermined target C
T
(and a valid endogenous
control).
At the levels above, the calibrator sample does not contain enough target cDNA for
an accurate comparison with the test sample. Therefore, the stated expression level is
the minimum possible value for the sample.
About the
Error Bars
The software displays error bars for each column in the plot if the associated
expression level was calculated from a group of two or more replicates. The error bars
display the calculated maximum (RQMax) and minimum (RQMin) expression levels
that represent standard error of the mean expression level (RQ value). Collectively, the
upper and lower limits define the region of expression within which the true expression
level value is likely to fall. The software calculates the error bars based on the (RQMin
and RQMax) confidence interval setting in the Analysis Settings dialog box.
Note:
Since standard deviation can only be calculated from two or more replicates,
the SDS software does not display error bars, RQMin and RQMax values, or standard
deviation (if either the target or the endogenous control has only a single sample).
Note:
Error bars are a representation of the likelihood of a random sample meeting
acceptance criteria based on standard of population, degrees of freedom, and RQ
Min/Max confidence values. The software does not display error bars for the
calibrator sample because it is compared to itself.
Undetermined
Samples and
Outlier Removal
The software declares sample as undetermined if the amplification curves for the
associated replicates in the group do not cross the threshold for the detector during
the duration of the run.
• If outlier removal is not turned on, then the software ignores any undetermined
wells and displays the C
T
of the remaining wells as the average C
T
.
• If outlier removal is turned on, then voting occurs. If the majority of the wells in
the sample replicate group are undetermined, then the software displays the
average C
T
as undetermined. If half or more of the wells have valid C
T
values,
then the software ignores the undetermined wells, removes outliers from the
remaining wells (if applicable), and averages the resulting data.
Down Arrow
Up Arrow
 Loading...


