DRAFT
September 1, 2004 11:39 am, CH_Real-Time.fm
Chapter 6 Analyzing Real-Time Data
6-34 Applied Biosystems 7900HT Fast Real-Time PCR System and SDS Enterprise Database User Guide
Viewing Relative
Quantities in the
Analysis Table
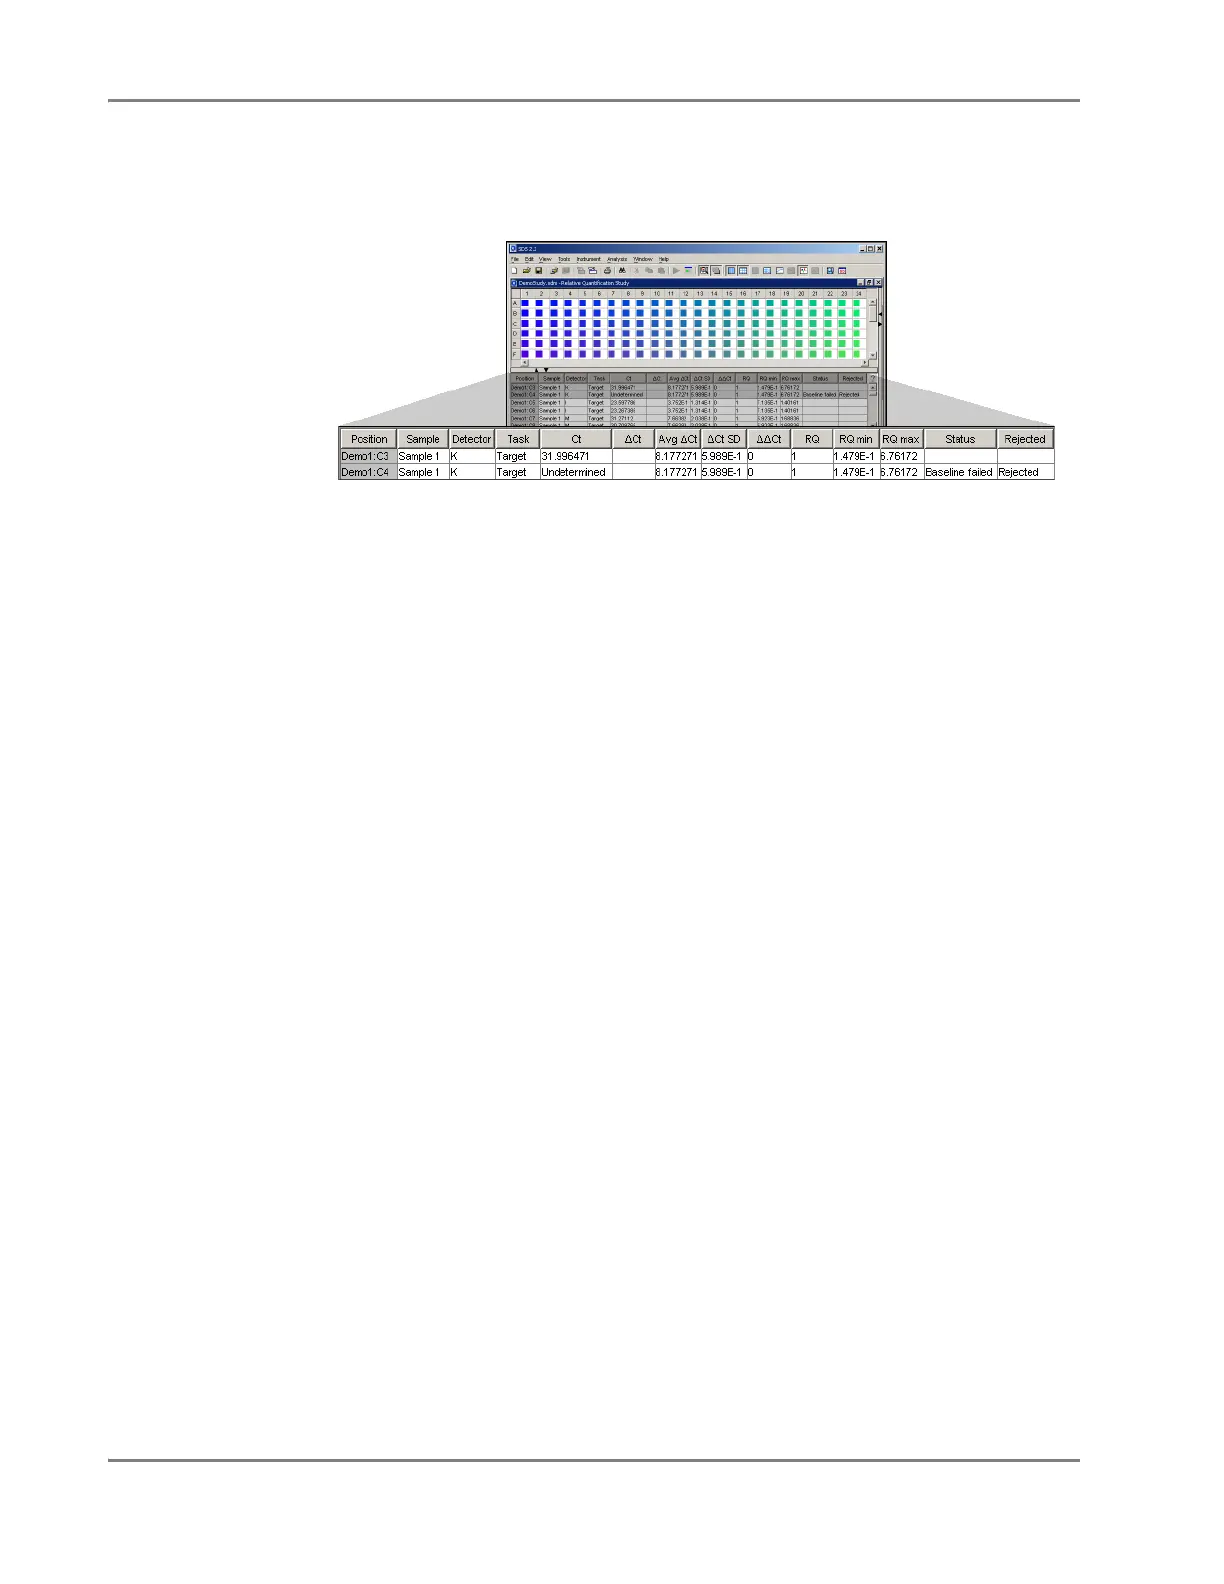
The software displays the results of the relative quantification calculation in the
Results table of the plate document. Figure 6-13 shows an example of the results
table containing the data from a TaqMan Human Cytokine Plate I.
s
Figure 6-13 Analysis Table of the Absolute Quantification Plate Document
The columns of the table are:
• Position – Displays the plate the sample is from and the position on the plate
(well number)
• Sample – Displays the name assigned to the well/sample when the associated
plate was run
• Detector – Displays
the
name of the detector assigned to the sample/well
position
• Task – Displays
the
task applied to the detector assigned to the sample/well
position
• C
T
– Displays the average calculated threshold cycle for the replicate group
associated with the test sample.
Note: The software displays Undetermined in the C
T
column when the
associated sample fails to produce a noticeable rise in fluorescent signal during
the entire PCR (the fluorescent signal produced by the well never crosses the
threshold level defined for the associated detector).
• ∆C
T
– Displays the normalized threshold cycle for the sample
• Avg ∆C
T
– Displays the averaged normalized threshold cycle for the sample
replicate group
• ∆C
T
SD – Displays the number of standard deviations from the average ∆C
T
of
the replicate group that the sample’s individual ∆C
T
value lies
• ∆∆C
T
– Displays the calculated ∆∆C
T
value for the replicate group associated
with the test sample.
• RQ – Displays the calculated relative level of gene expression for the replicate
group associated with the test sample.
• RQ min – Displays the minimum calculated relative level of gene expression in
the test samples
• RQ max – Displays the maximum calculated relative level of gene expression
in the test samples
• Status – When autocalling is enabled and a sample is reject by the algorithm,
the status field indicates how the sample failed the analysis.
•
Rejected
– When autocalling is enabled, indicates if the sample data was rejected.