DRAFT
September 1, 2004 11:39 am, CH_Real-Time.fm
Viewing Results
Applied Biosystems 7900HT Fast Real-Time PCR System and SDS Enterprise Database User Guide 6-13
Viewing Results
Viewing the
Standard Curve
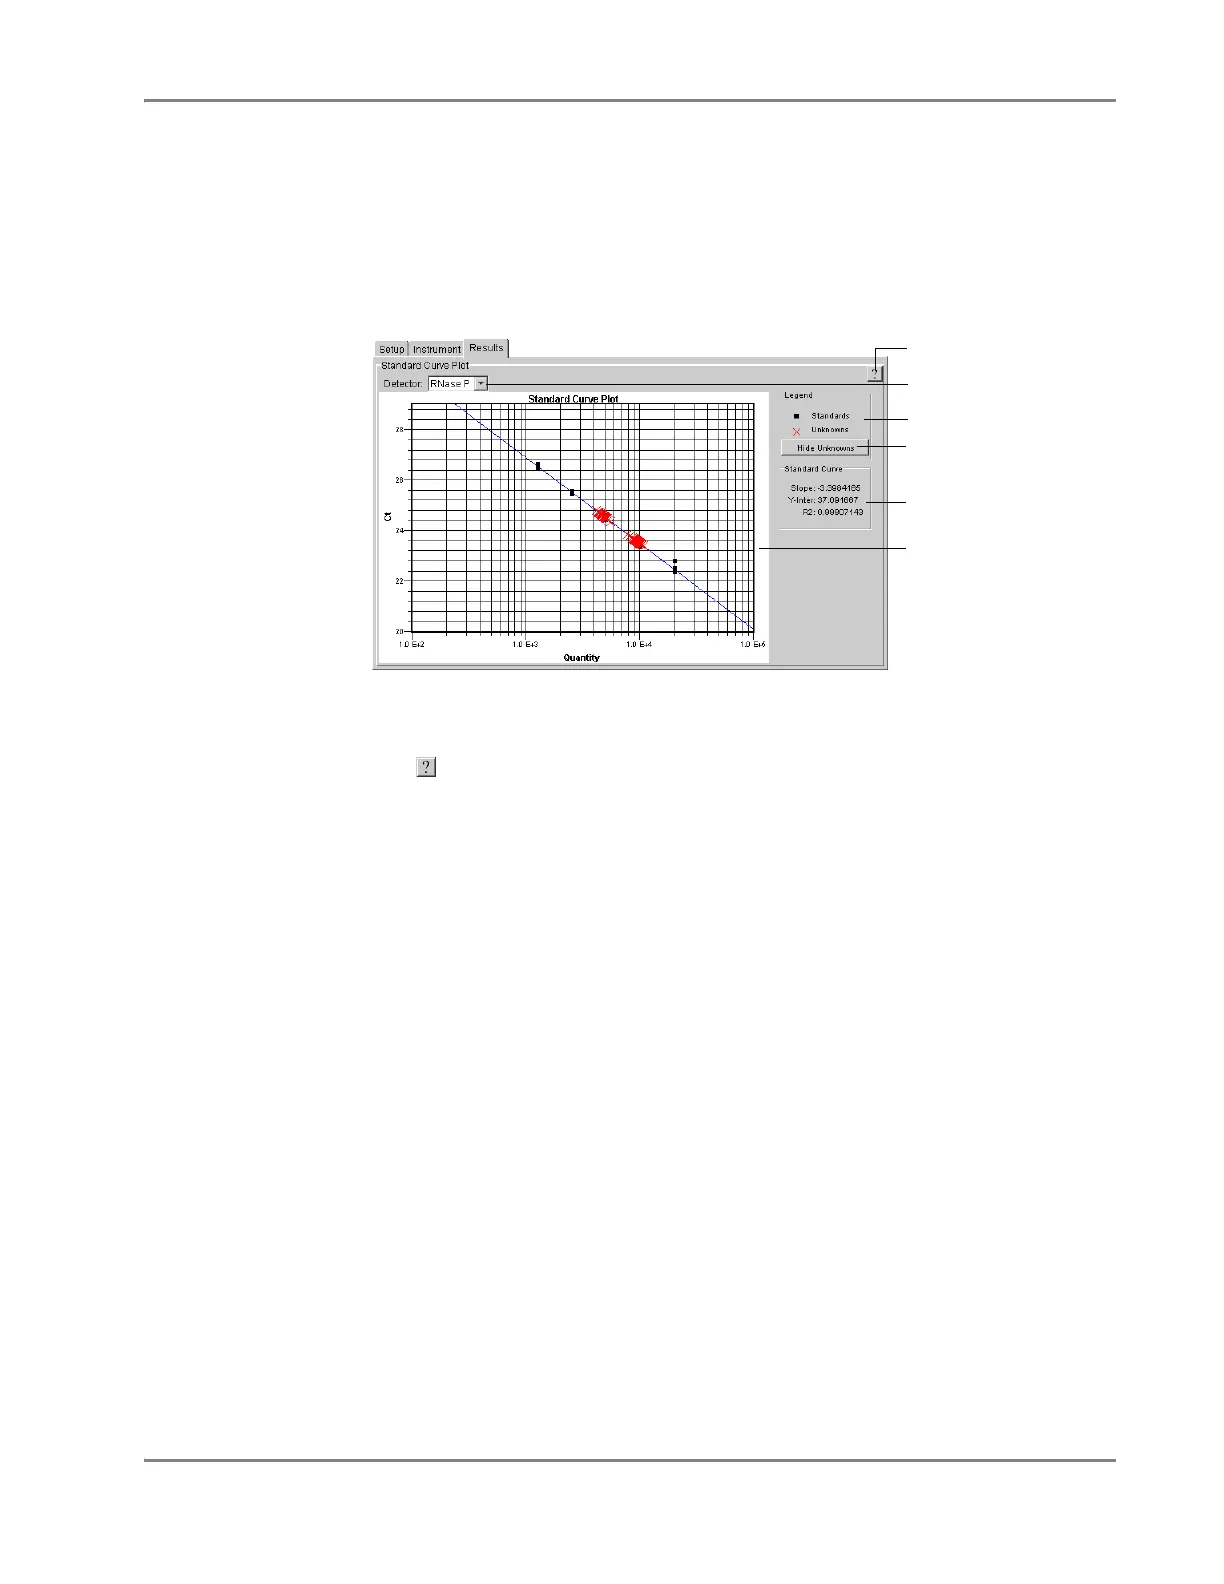
The software displays the standard curve generated from the run data within the
Results tab of the plate document. The standard curve plot displays the unknown
samples on a graph of C
T
(threshold cycle) vs. Quantity (LogN). Figure 6-5
illustrates the components of the standard curve plot.
Figure 6-5 Components of the Standard Curve Plot
• – Starts the Sequence Detection Systems Software Online Help.
• Detector menu – Toggles the data displayed within the plot based on detector
name.
• Legend box – Displays a symbol key for the datapoints appearing in the plot.
• Hide Unknowns button – Toggles the presence of data from unknown samples
in the plot.
• Standard Curve box – Contains the following statistical data describing the
standard curve.
– Slope – The slope of the standard curve. The slope of the standard curve is
useful for assessing the efficiency of the assay. At 100% efficiency, a reaction
should achieve a slope of −3.33 since every 10-fold difference in quantity
translates to a difference of 3.33 C
T
s.
– Y- I n t e r – The Y-axis intercept of the standard curve.
– R2 – The R square value for the standard curve that describes the correlation
between threshold cycles (C
T
) and the log of the quantity value for the
samples that comprise the standard curve plot. The calculation yields a value
between 1 and 0, where values closer to 1 indicate better correlation between
C
T
and the log of the quantity value.
Note: The software calculates the R square value by taking the square of the
Pearson Coefficient of Correlation (also known as the r value) calculated for the
data points that comprise the plot. The software calculates the R2 value only for
the standards that make up the curve.
• Standard curve plot – A scatterplot of datapoints from the absolute
quantification run.
Detector drop-down list
Legend box
Hide Unknowns button
Standard Curve box
Standard curve plot
Help button