DRAFT
September 1, 2004 11:39 am, CH_Real-Time.fm
Chapter 6 Analyzing Real-Time Data
6-44 Applied Biosystems 7900HT Fast Real-Time PCR System and SDS Enterprise Database User Guide
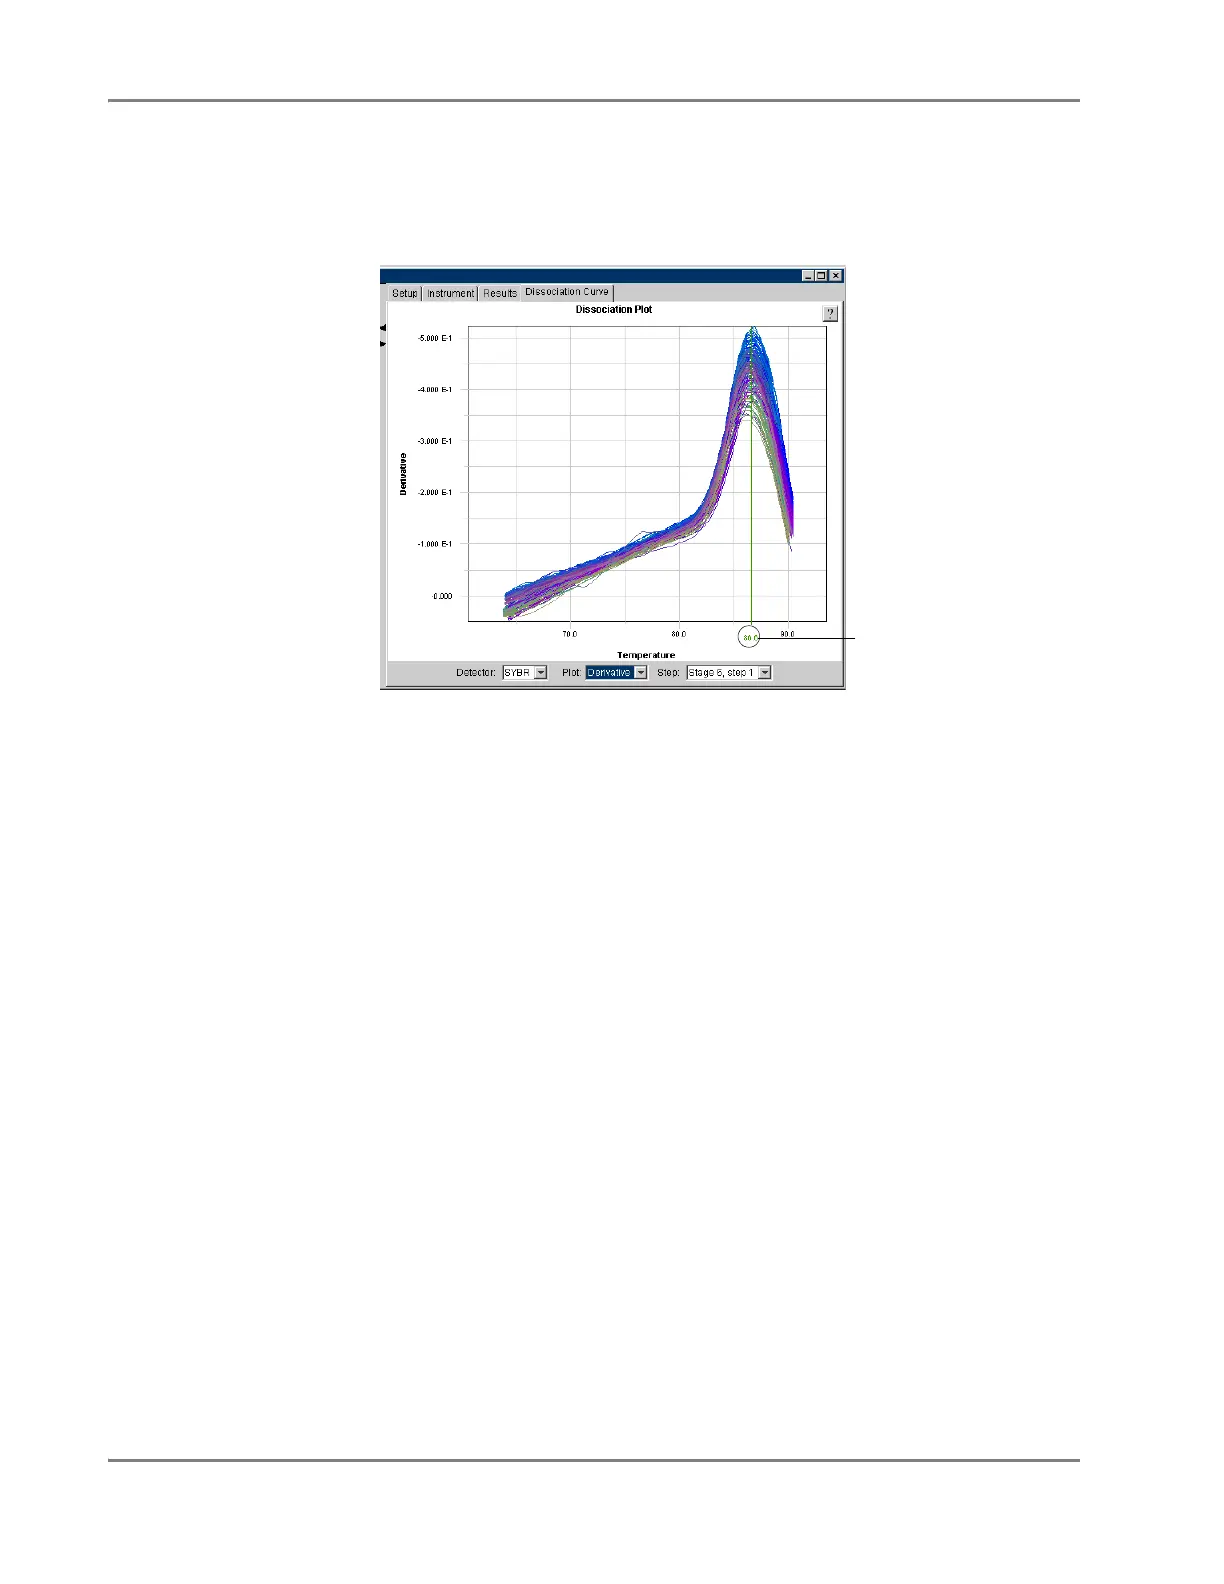
Determining
T
m
Values
1. Move the pointer over the green T
m
line located on the Y-axis line of the plot.
2. Click and drag the T
m
line to the maximum point of the derivative plot of interest.
The SDS software displays the T
m
for the curve below the T
m
line.
Note: The apex of the curvature of represents the maximum rate of change in
normalized fluorescence.
After the Analysis
User Access
Requirement
If using the SDS Enterprise Database, you must belong to the Scientist or
Administrator User Group to save analyzed data from a dissociation curve experiment.
Post-Analysis
Options
Changing the Display Settings . . . . . . . . . . . . . . . . . . . . . . . . . . . . . . . . . . . . . . 6-52
Printing a Report . . . . . . . . . . . . . . . . . . . . . . . . . . . . . . . . . . . . . . . . . . . . . . . . . 6-52
Exporting Plate Document Data . . . . . . . . . . . . . . . . . . . . . . . . . . . . . . . . . . . . . 6-52
Saving the Results . . . . . . . . . . . . . . . . . . . . . . . . . . . . . . . . . . . . . . . . . . . . . . . . 6-53
T
m
display and slider