DRAFT
September 1, 2004 11:39 am, CH_Real-Time.fm
Determining T
m
Values for the Analyzed Run
Applied Biosystems 7900HT Fast Real-Time PCR System and SDS Enterprise Database User Guide 6-43
•T
m
display and slider –
The SDS software displays the
T
m
below the green slider
(see below).
There are two definitions for the T
m
value:
– The chemical definition is the temperature at which 50% of the DNA is in a
double-stranded configuration.
– The mathematical definition is the maximum value for the first derivative
curve within a specific peak.
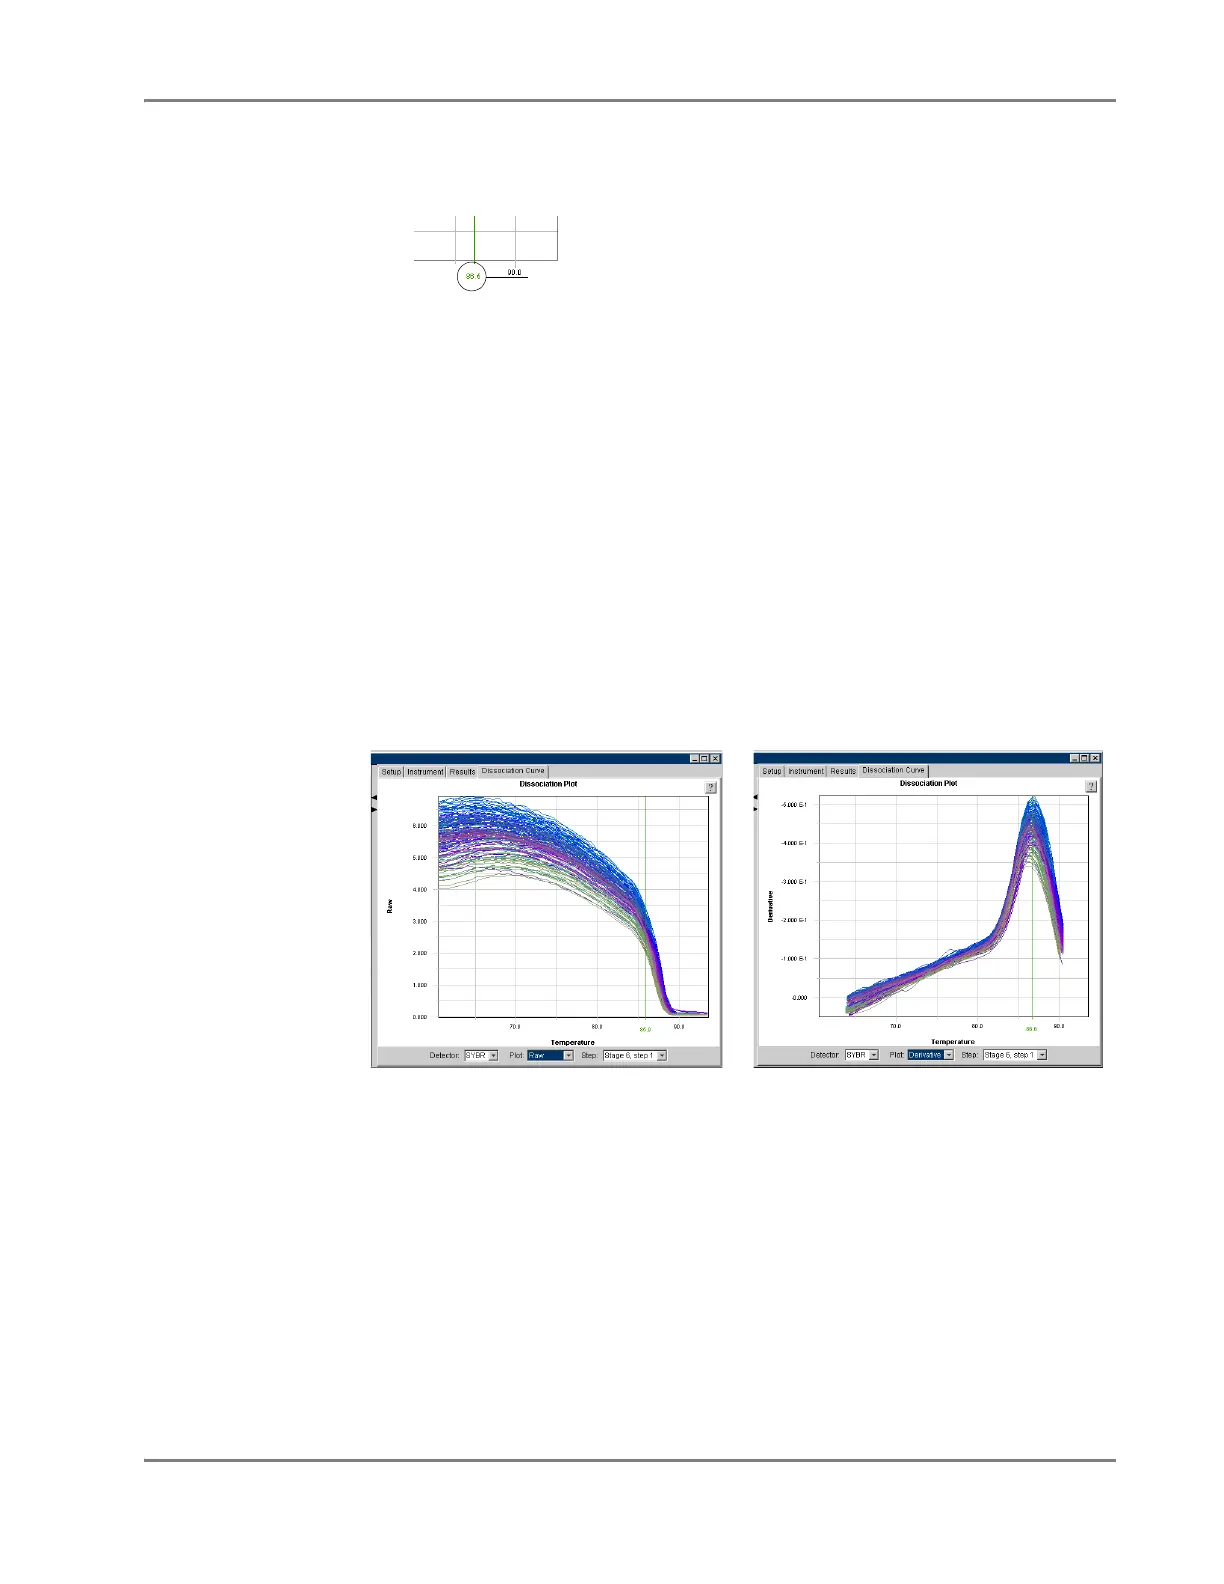
• Plot drop-down list – Chooses the data displayed within the plot based on the
derivative calculation. The list offers the following selections:
– Raw – When selected, this option plots the normalized reporter fluorescence
data (R
n
) on a graph of fluorescence vs. temperature (left-most plot in
Figure 6-16).
– Derivative – When selected, this option plots derivative data (R
n
´) on a graph
of the derivative vs. temperature (right-most plot in Figure 6-16). The
derivative data is the negative of the rate of change in fluorescence as a
function of temperature.
Figure 6-16 shows the plots accessible from the Plot drop-down list.
Figure 6-16 Plots of the Dissociation Curve Tab
• Detector drop-down list – Chooses the data displayed within the plot based on
detector name.
T
m
Raw Plot Derivative Plot