DRAFT
September 1, 2004 11:39 am, App_Theory.fm
Appendix D Theory of Operation
D-4 Applied Biosystems 7900HT Fast Real-Time PCR System and SDS Enterprise Database User Guide
Real-Time Data Analysis
Kinetic Analysis/
Quantitative PCR
The 7900HT instrument can be used to determine the absolute or relative quantity of
a target nucleic acid sequence in a test sample by analyzing the cycle-to-cycle change
in fluorescence signal as a result of amplification during a PCR. This form of
quantitative PCR analysis, called “kinetic analysis,” was first described using a
non-sequence-specific fluorescent dye, ethidium bromide, to detect PCR product
(Higuchi et al., 1992; Higuchi et al., 1993). The use of TaqMan probes and reagents
further enhances the method by providing sequence-specific amplification of
multiple targets for ‘comparative’ or ‘relative’ quantification. The fewer cycles it
takes to reach a detectable level of fluorescence, the greater the initial copy number
of the target nucleic acid.
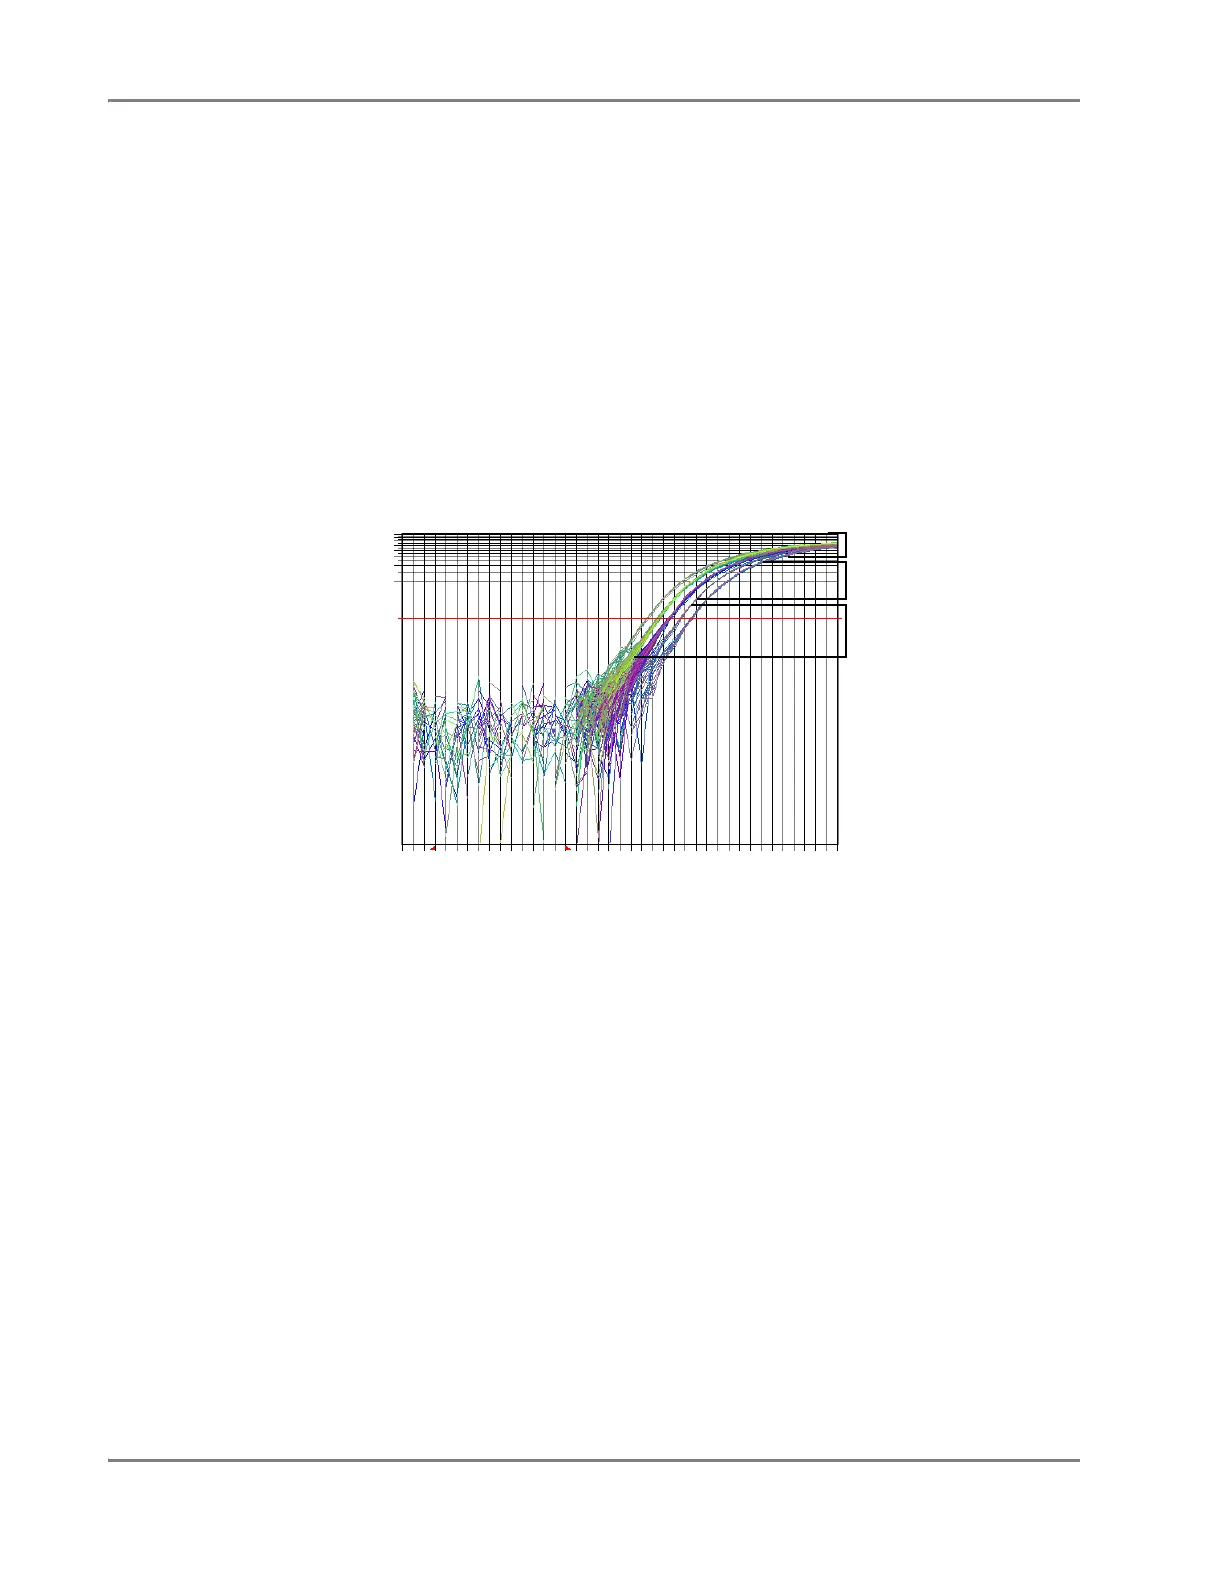
Figure D-3 Phases of a Typical Amplification Curve
When graphed in real-time on a linear scale, normal amplification of PCR product
generates a curve similar to the one shown in Figure D-3. This ‘amplification’ curve
consists of three distinct regions that characterize the progression of the PCR.
Phase 1: Geometric (Exponential)
Detection of the high-precision geometric phase is the key to high-precision
quantitative PCR. The geometric phase is a cycle range of high precision during
which amplification is characterized by a high and constant efficiency. It occurs
between the first detectable rise in fluorescence and before the beginning of the
linear phase. When plotted on a log scale of DNA vs. cycle number, the curve
generated by the geometric phase should approximate a straight line with a slope.
The 7900HT instrument typically delivers sufficient sensitivity to detect at least
3 cycles in the geometric phase, assuming reasonably optimized PCR conditions.
Phase 1, geometric
Phase 2, linear
Phase 3, plateau
Cycle Number
R
n
403020100
0.0
1.0
2.0
8.0
Amplification Plot