DRAFT
September 1, 2004 11:39 am, App_Theory.fm
Real-Time Data Analysis
Applied Biosystems 7900HT Fast Real-Time PCR System and SDS Enterprise Database User Guide D-5
Phase 2: Linear
The linear phase is characterized by a leveling effect where the slope of the
amplification curve decreases steadily. At this point, one or more components have
fallen below a critical concentration and the amplification efficiency has begun to
decrease. This phase is termed linear, because amplification approximates an
arithmetic progression, rather than a geometric increase. Because the amplification
efficiency is continually decreasing during the Linear phase, it exhibits low
precision.
Phase 3: Plateau
Finally, the amplification curve achieves the plateau phase at which time the PCR
stops and the R
n
signal remains relatively constant.
Determining
Initial Template
Concentration
and Cycle
Number
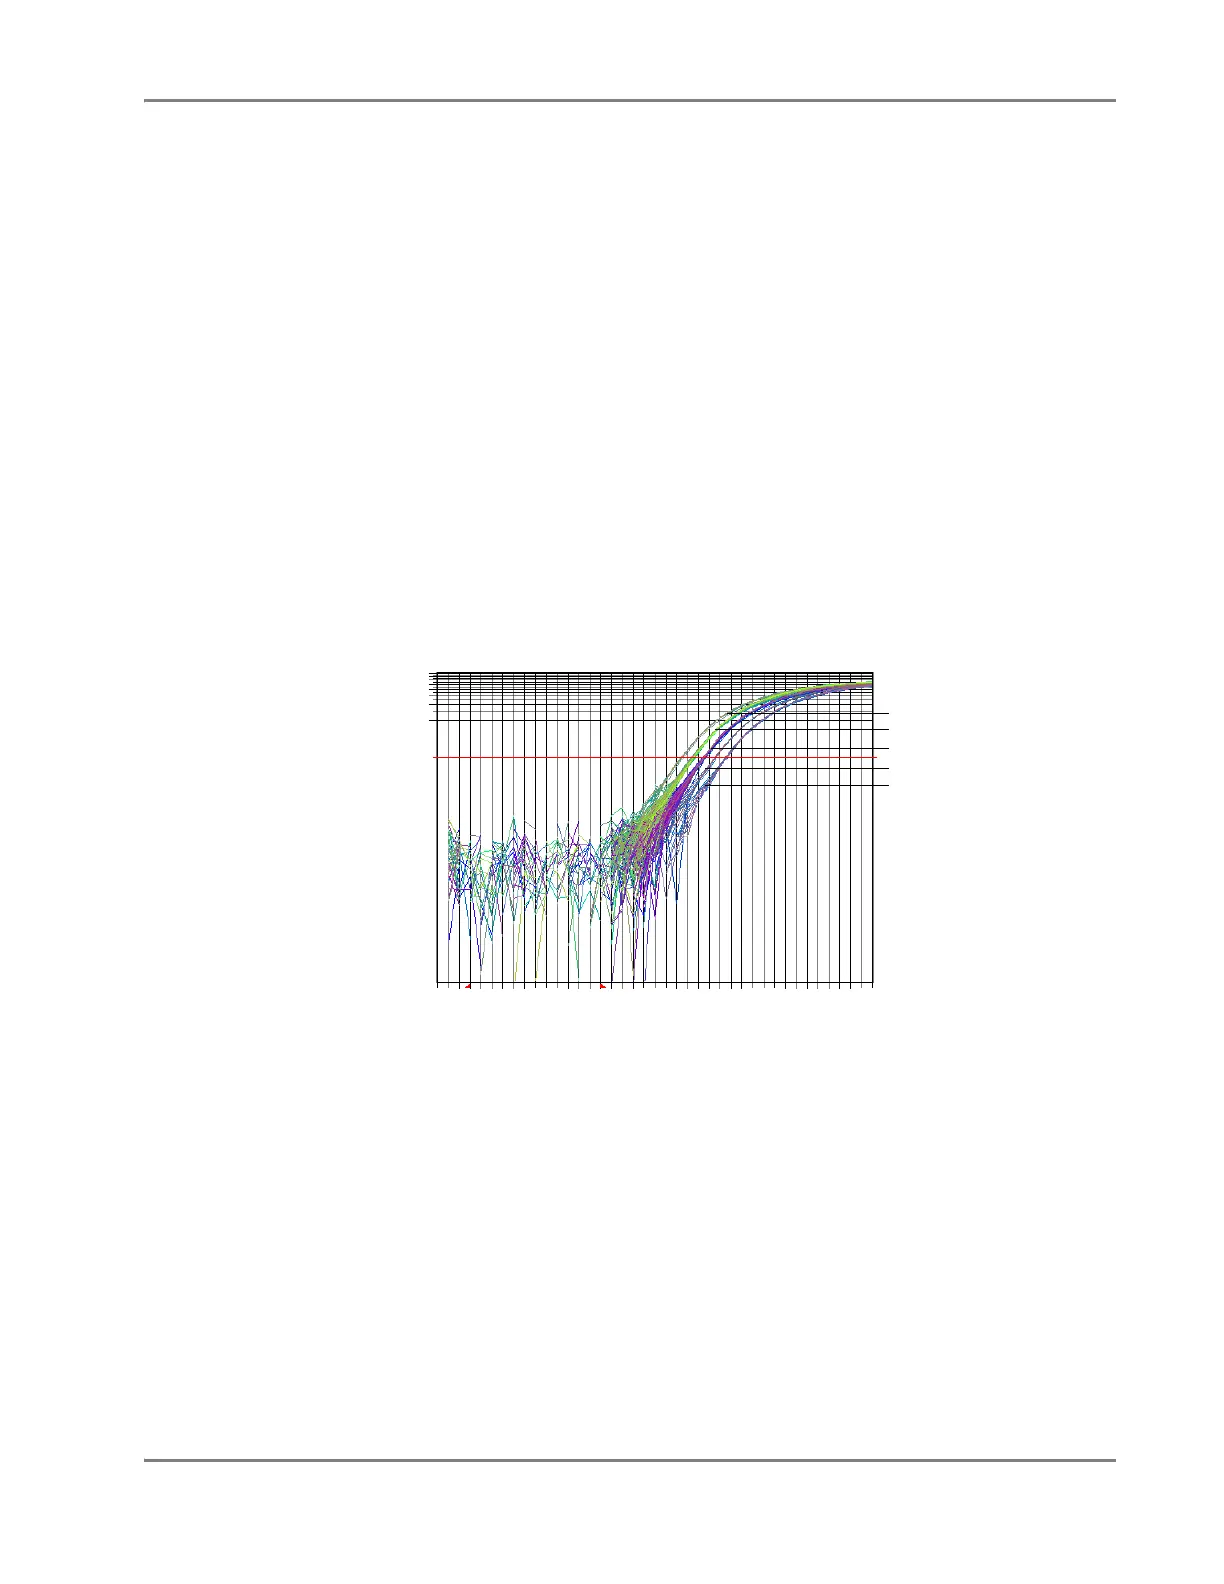
At any given cycle inside the geometric phase of PCR, the amount of product is
proportional to the initial number of template copies. When one template is diluted
several times, as with the RNase P target in the RNase P Instrument Verification
Plates (see Appendix C), the ratio of template concentration to detectable signal is
preserved in the exponential phase for all dilutions (see Figure D-4). This
relationship appears to change as rate of amplification approaches a plateau.
Figure D-4 Amplification Plot from a Real-Time Run of an RNase P Instrument
Verification Plate
2500
10000
20000
Cycle Number
R
n
403020100
0.0
1.0
2.0
8.0
5000
1250