DRAFT
September 1, 2004 11:39 am, CH_Real-Time.fm
Chapter 6 Analyzing Real-Time Data
6-42 Applied Biosystems 7900HT Fast Real-Time PCR System and SDS Enterprise Database User Guide
Determining T
m
Values for the Analyzed Run
Viewing Analyzed
Dissociation
Curve Data
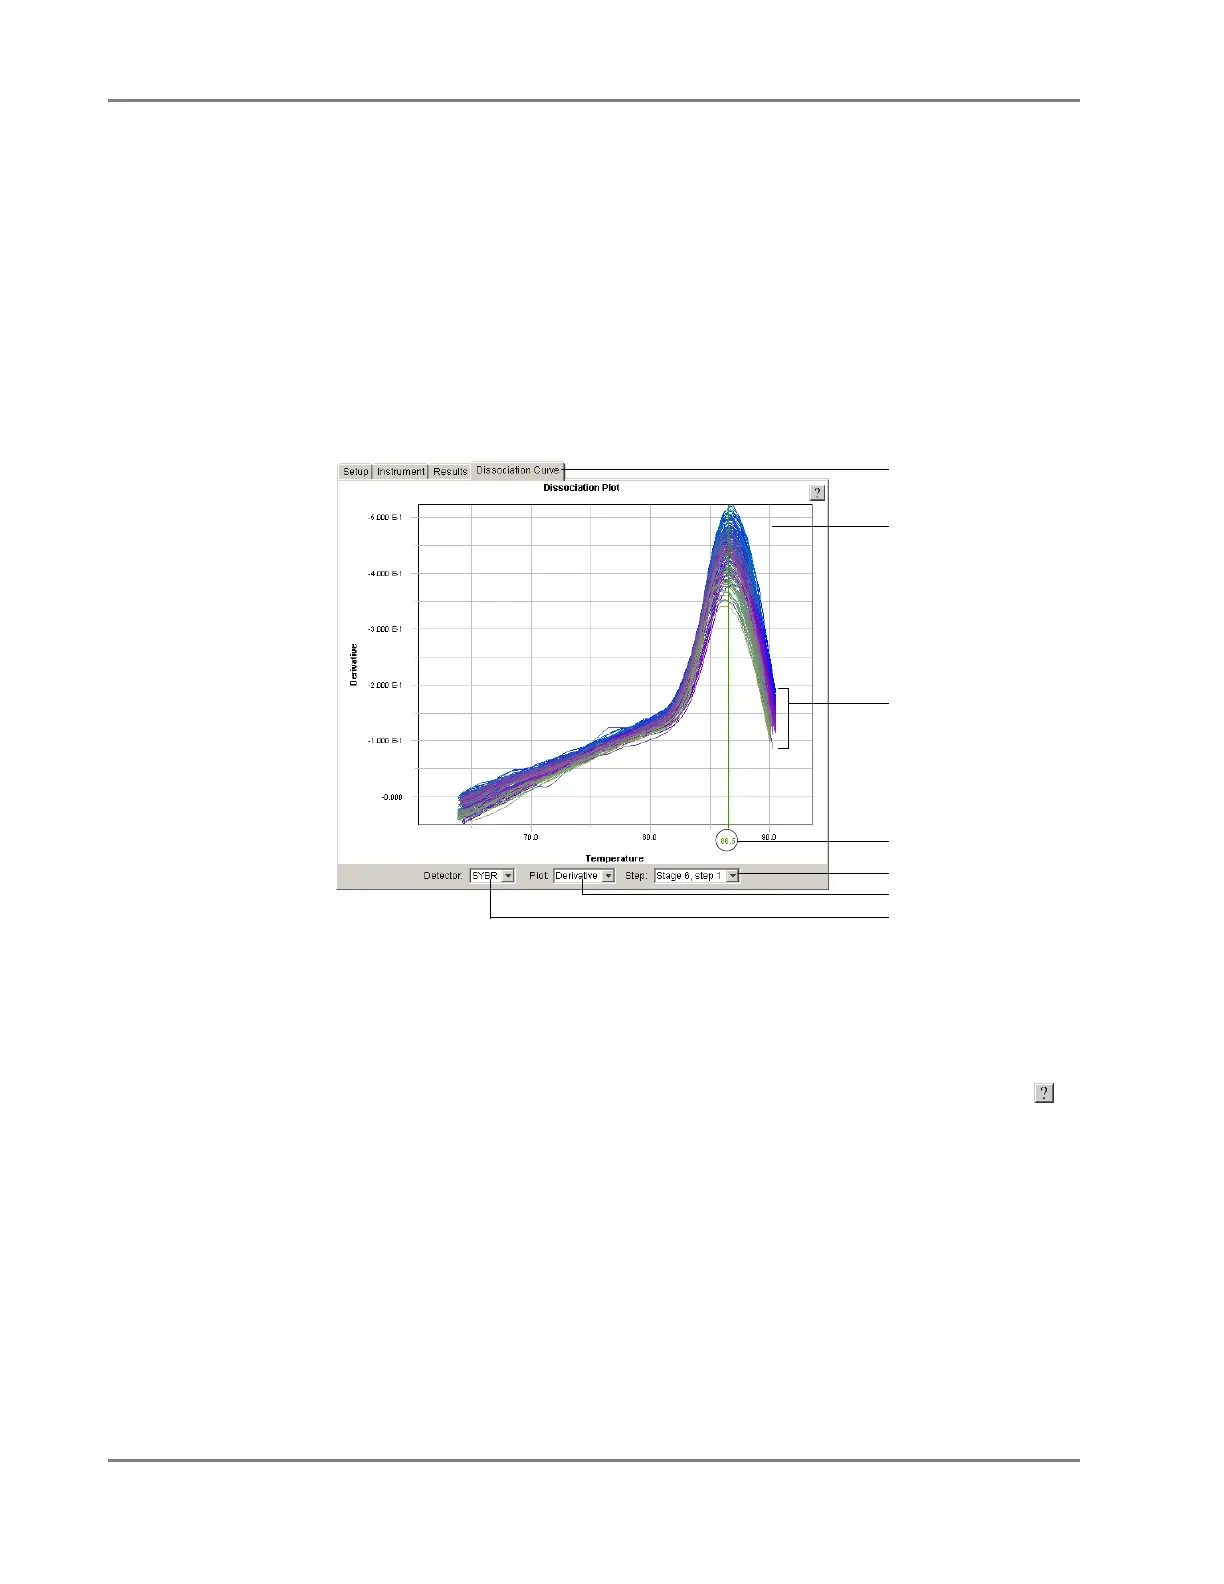
The SDS software displays the results of the dissociation curve analysis within the
Dissociation Curve tab of the plate document. The tab displays the analyzed data in a
graph of the negative of the derivative (-R
n
´) versus temperature (T) that visualizes
the change in fluorescence at each temperature interval during the ramp.
Note: The plot displays data from the selected wells of the plate grid. If you do not
see dissociation curve data, select the wells of the plate grid containing the SYBR
Green dye reactions.
Figure 6-15 illustrates the components of the Dissociation Plot.
Figure 6-15 Elements of the Dissociation Plot
• Dissociation plot – The plot displays data from the selected wells in the plate grid.
Note: The properties of the Dissociation Plot are adjustable. For more
information on adjusting the appearance of the plot, click the help button ( )
and see the Sequence Detection Systems Software Online Help.
• Step drop-down list – Chooses the data displayed within the plot based on the
ramp.
If a plate document contains data from more than one temperature ramp, the
Step drop-down list allows you to displays the data from each by selecting the
position of the ramp in the thermal profile.
Detector drop-down
Plot drop-down list
Step drop-down list
Dissociation Plot
Dissociation curves
T
m
display and slider
Dissociation Curve tab