624074/07 C-11
To monitor progress over time, it is recommended you plot
trends for Pinsp, fTotal, and fSpont. Interpret these trends,
together with the %MinVol setting. Table C-2 through
Table C-4 provide interpretation of typical ventilatory patterns.
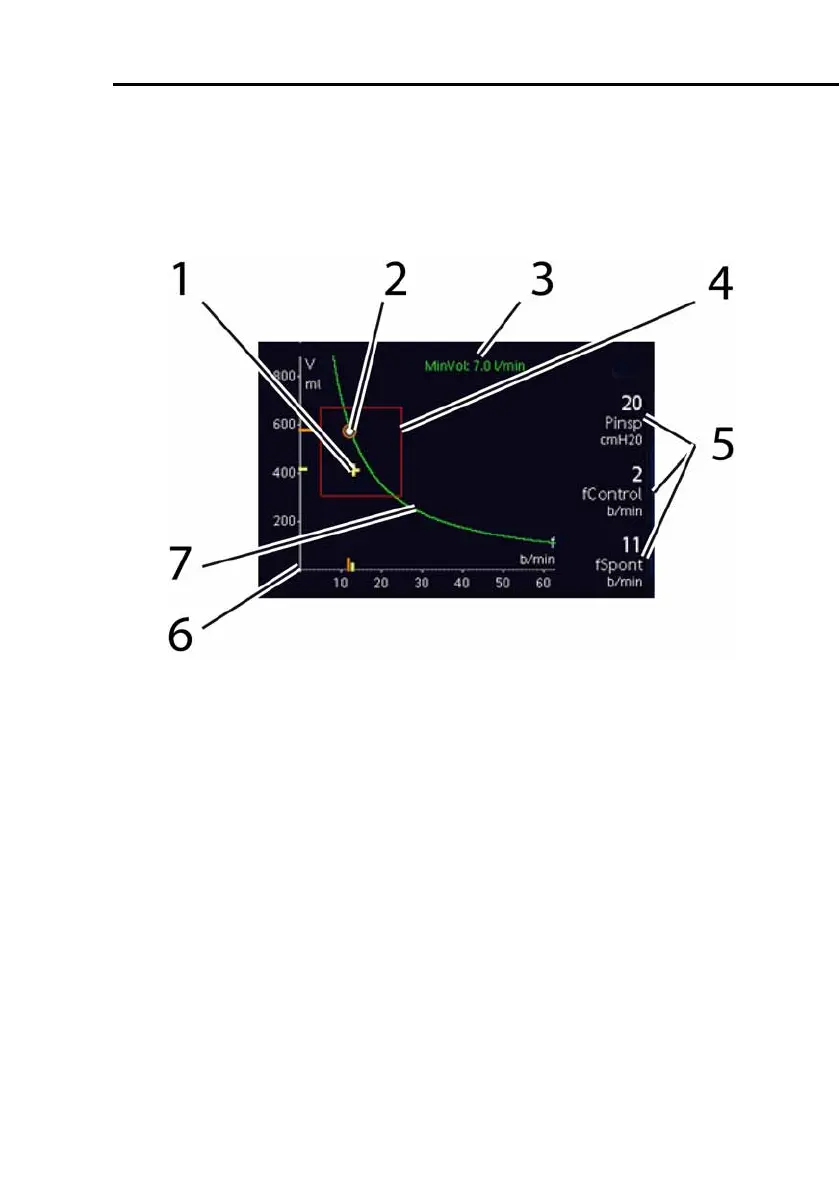
Figure C-4 shows the ASV adjustment/weaning process.
Figure C-4. ASV target graphics window
1 Current measured point, formed by intersection of
measured tidal volume and rate.
2 Target point, formed by intersection of target tidal
volume and target rate.
3 Numerical value of target minute volume
4 Safety frame in which target point may move.
5 FSpont = spontaneous breath rate, fControl = machine
rate, Pinsp = inspiratory pressure set by ventilator
6 Horizontal axis for rate (f). Vertical axis for tidal volume
(Vt).
7 Minute volume curve.