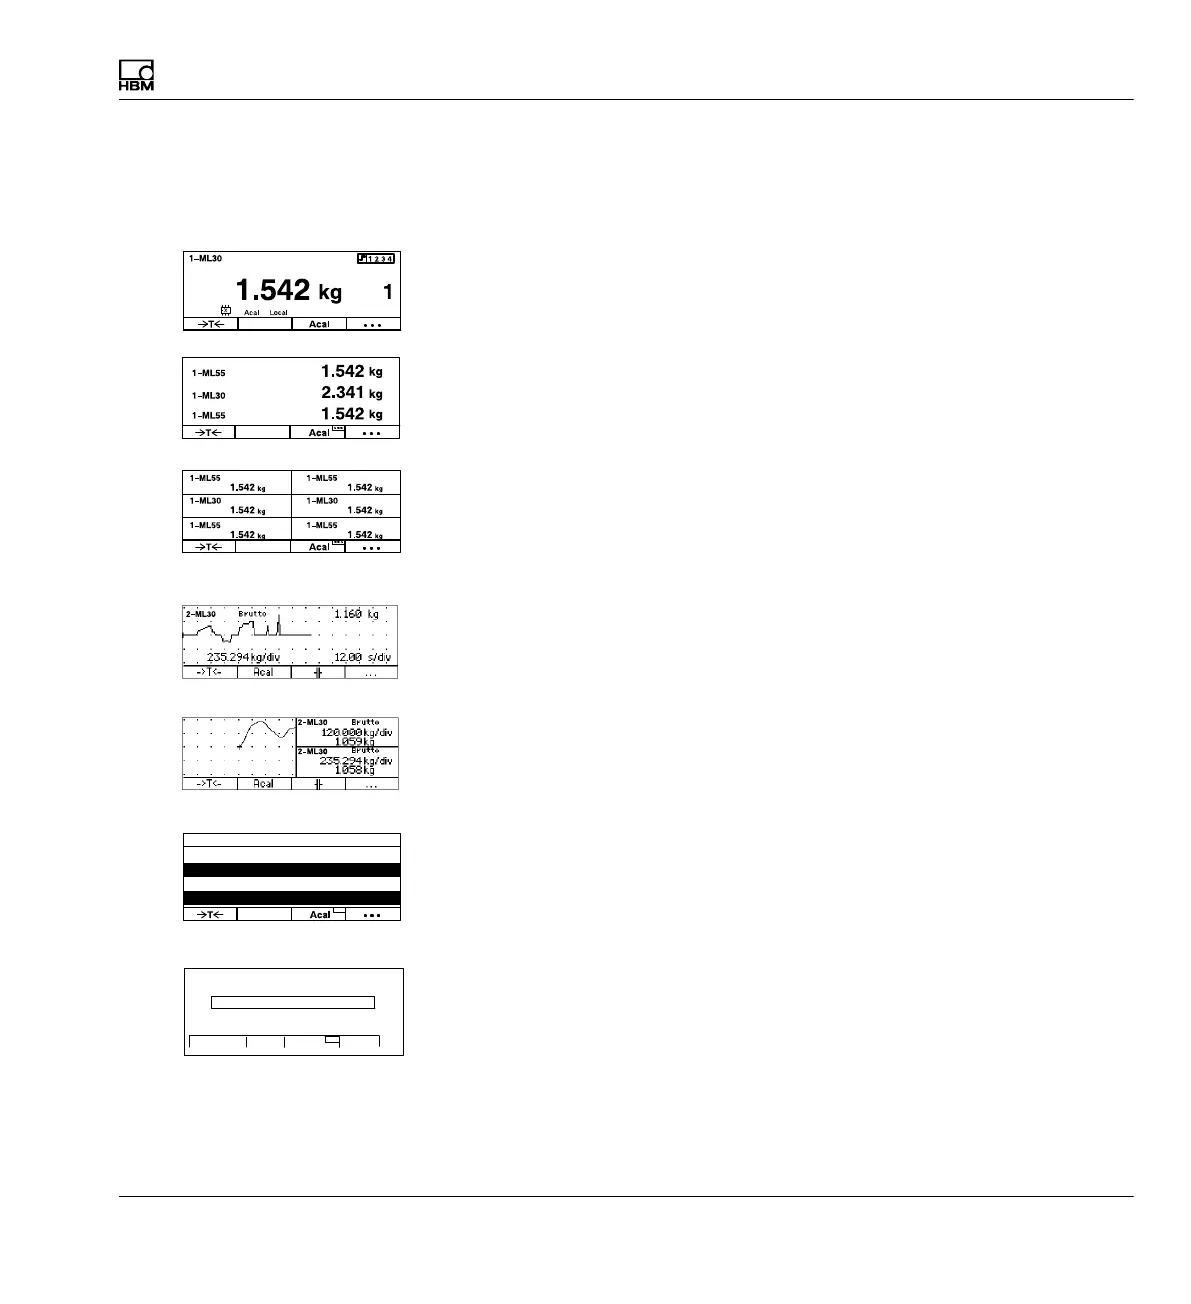
Display
Display format
MGCplus A0534-30.0 HBM: public 213
9 Display
9.1 Display format
The settings affect how the selectable signals in the display are realized.
Normally you can select four different signals (gross, net, limit values and
peak values) for each channel.
The measured values can be realized as numeric values or as a graph. A
maximum of six measured values can appear at the same time in the nu
meric value realization.
The display states shown on the left, referred to as Image types, can be se
lected in the setting menu.
Realization as numeric value
S 1 measured value (with/without status line)
S 3 measured values
S 6 measured values
Realization as a graph
S y‐t realization
S x‐y realization
Display of four limit value states
S Limit value status
Display with image type “Recording"
S Pre‐trigger status
S Post‐trigger status
1 measured value
3 measured values
6 measured values
y−t realization
x-y realization
Limit value status
1−ML30 Gross 8.483 kN
1−LV1 Below 10kN
1−LV2 Below 20kN
1−LV3 NOK
Test series 3 SAMPLING RATE: 50Hz
TIME: 00: 00: 00 PERIODS: 100
FILE NAME:MGCP0000.MEA
120 MB FREE
Load AP1
Acal
−4.0S
16.0S
1
Recording status
...
...
Measure
Measure
Measure
Measure
Measure
Channel
Gross
Gross
Gross
Gross
Gross
Gross
Gross
Gross
Gross
Gross
LIMIT VALUE