Display
Display format
MGCplus A0534-30.0 HBM: public 227
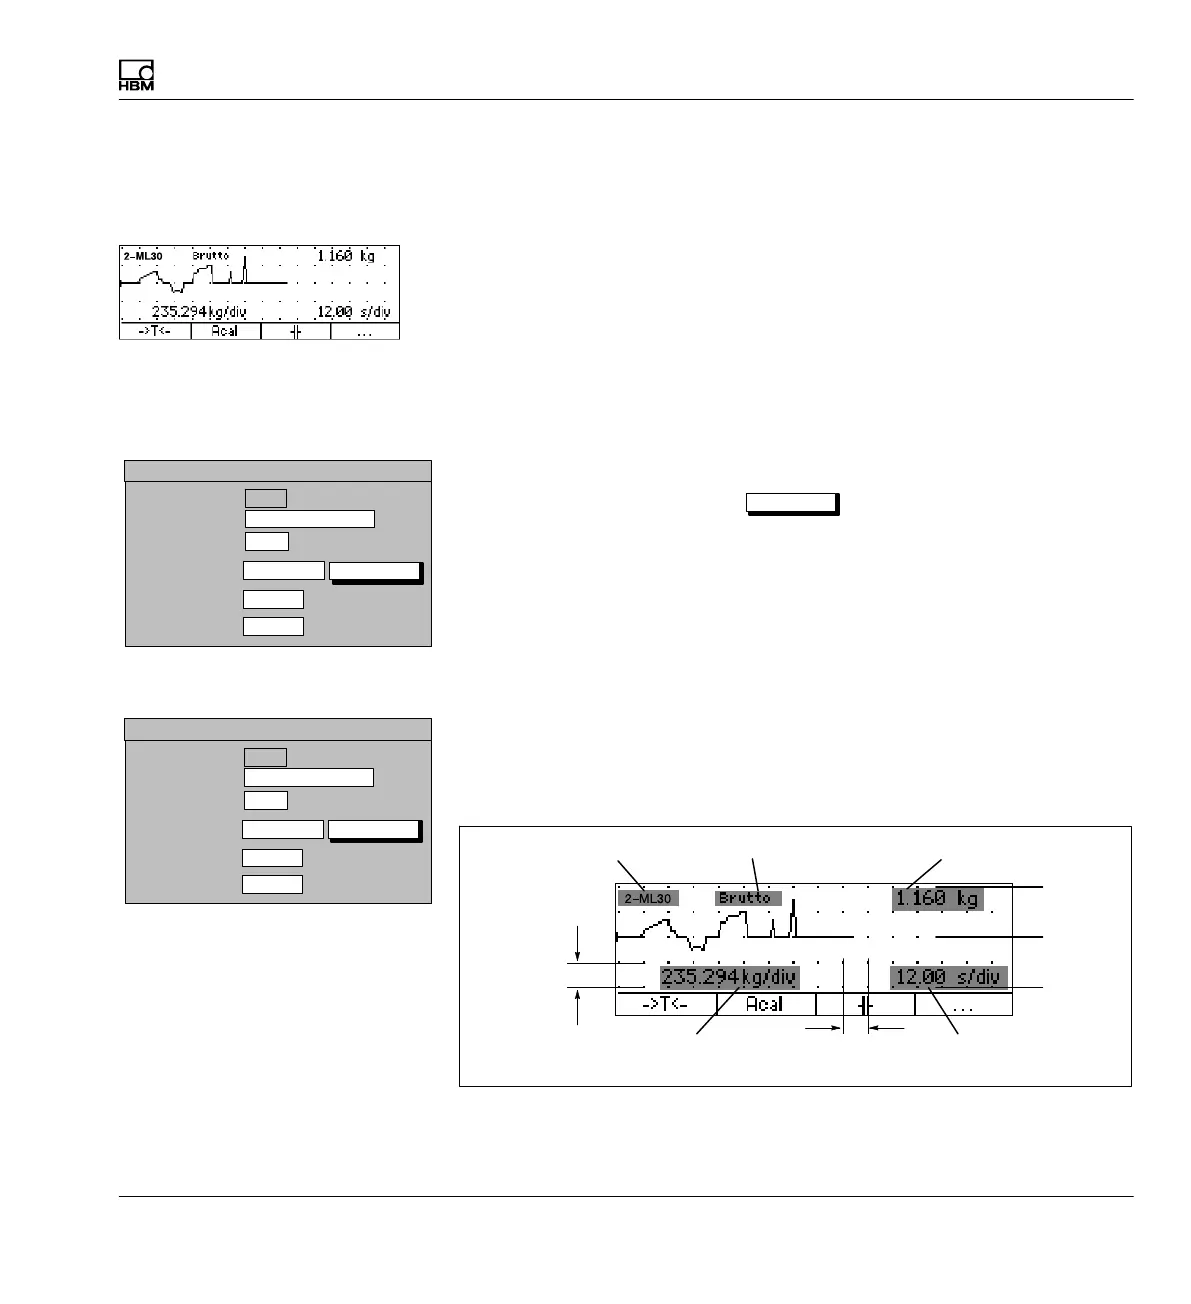
9.1.3.2 Graphic display
y-t realization
This realization allows you to consider the progression of measured values
over time.
Sampling rate
Time interval of signal sampling.
Channels/signals
You can define here which channels will be realized with which signals in
the display. You can define your settings for all channels or only for certain
ones (Selection) (button symbol
define...
). You can call a maximum of
four signals one after the other per channel.
define...
Button symbol opens new window Channel/signal selection.
y
max
Maximum value of the display relative to the current measuring range (as a %).
y
min
Minimum value of the display relative to the current measuring range (as a %).
Current measured value
Current measurement signal
Time grid
1 subunit
y grid
Scaling
y grid
1 subunit
Time grid
Scaling
Current channel
Y
MIN
Y
MAX
Zero point
Image type yt realization
Setup window
Sampling rate
0 ...
YT realization
1s
Image no.:
Image type:
DISPLAY FORMAT YT realization
Channels/signals:
Selection
define...
YMax
100...
%
YMin
-100...
%
Setup window
Sampling rate
0 ...
YT realization
1s
Image no.:
Image type:
DISPLAY FORMAT YT realization
Channels/signals:
All
define...
YMax
100...
%
YMin
-100...
%